تحليل بيانات Titanic – دراسة استكشافية شاملة (EDA) - Titanic Data Analysis – Comprehensive Exploratory Study (EDA)
تفاصيل العمل

نظرة عامة على المشروع:
يمثل هذا المشروع تحليلًا استكشافيًا شاملًا (Exploratory Data Analysis) لبيانات ركاب سفينة Titanic الشهيرة، بهدف تحويل البيانات الخام إلى رؤى تحليلية دقيقة تكشف أنماط البقاء والعوامل الاجتماعية والاقتصادية المؤثرة فيه.
يُظهر هذا التحليل قدرتي على تنظيف البيانات، استكشافها، تصورها، واستخلاص النتائج الذكية منها باستخدام أدوات تحليل البيانات بلغة Python.
أهداف المشروع:
تحليل الخصائص الديموغرافية للركاب واكتشاف العوامل المؤثرة في النجاة.
دراسة العلاقة بين العمر، النوع، الدرجة، والسعر وتأثيرها على فرص البقاء.
إبراز مهاراتي في معالجة البيانات، الهندسة المميّزة، والتحليل البصري.
تقديم رؤى قابلة للتطبيق مدعومة بتمثيلات بيانية دقيقة وسهلة الفهم.
? الأساليب التحليلية المستخدمة:
تنظيف ومعالجة البيانات (التعامل مع القيم المفقودة، الأنماط غير الطبيعية، وتحويل الأنواع).
تحليل السمات لتحديد أبرز المؤشرات المؤثرة في النجاة.
التمثيل البصري باستخدام Matplotlib، Seaborn، وPlotly لإظهار العلاقات والاتجاهات.
التحليل الإحصائي للتحقق من صحة الارتباطات والنتائج.
سرد قصصي تحليلي يربط الأرقام بالمغزى الواقعي وراءها.
️ الأدوات والتقنيات:
Python (Pandas, NumPy, Matplotlib, Seaborn, Plotly)
Jupyter Notebook
تقنيات التحليل البصري وسرد البيانات (Data Storytelling)
أهم النتائج:
نسبة نجاة الإناث والأطفال كانت الأعلى.
ركاب الدرجة الأولى امتلكوا فرص نجاة أكبر بكثير.
الطبقة الاجتماعية والمستوى الاقتصادي أثّرا بشكل مباشر في فرص الإنقاذ.
السعر والعمر لهما علاقة قوية بمعدلات البقاء.
النتيجة النهائية:
هذا المشروع يعكس مزيجًا من المهارة التقنية والفكر التحليلي مع قدرة قوية على تحويل البيانات إلى قصة رقمية واضحة.
وهو مثال عملي على مستوى الاحتراف في التحليل الاستكشافي، التمثيل البصري، واستخلاص الرؤى، مما يجعله إضافة مثالية لأي ملف أعمال احترافي في مجال تحليل البيانات.
:Project Overview
This project is a comprehensive Exploratory Data Analysis (EDA) of the famous Titanic passengers dataset, aiming to convert raw data into precise analytical insights that reveal survival patterns and the social and economic factors that influence them.
This analysis demonstrates my ability to clean, explore, visualize, and derive intelligent conclusions from data using Python-based data analysis tools.
:Project Objectives
Analyze passengers’ demographic characteristics and identify the factors that influence survival.
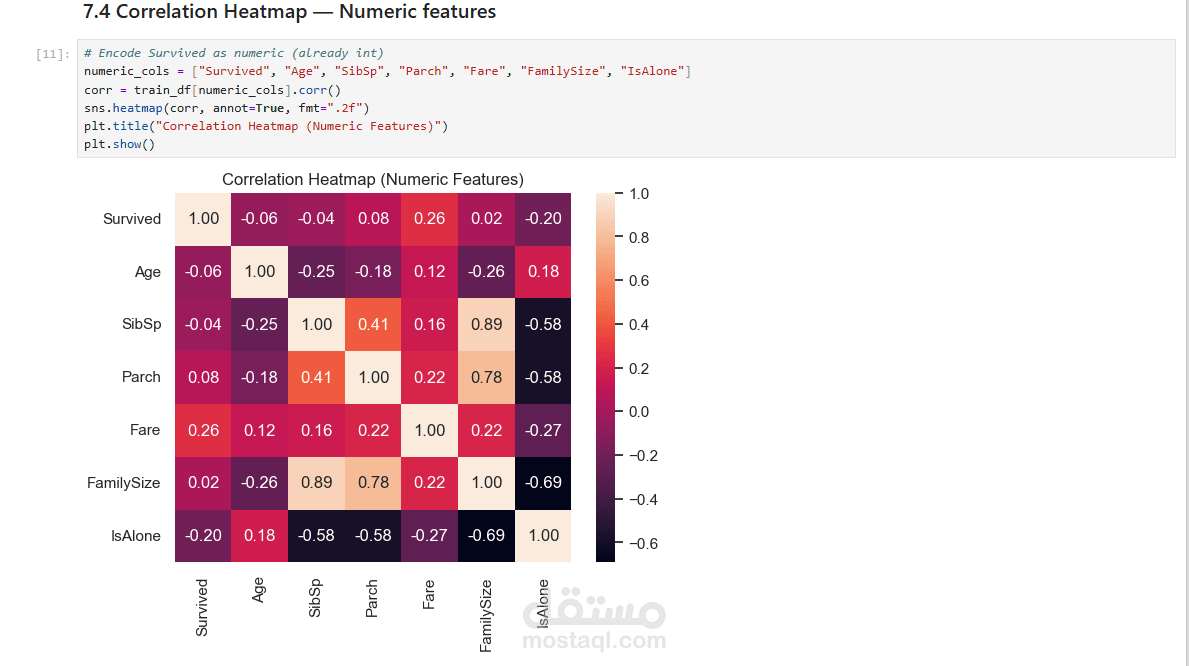
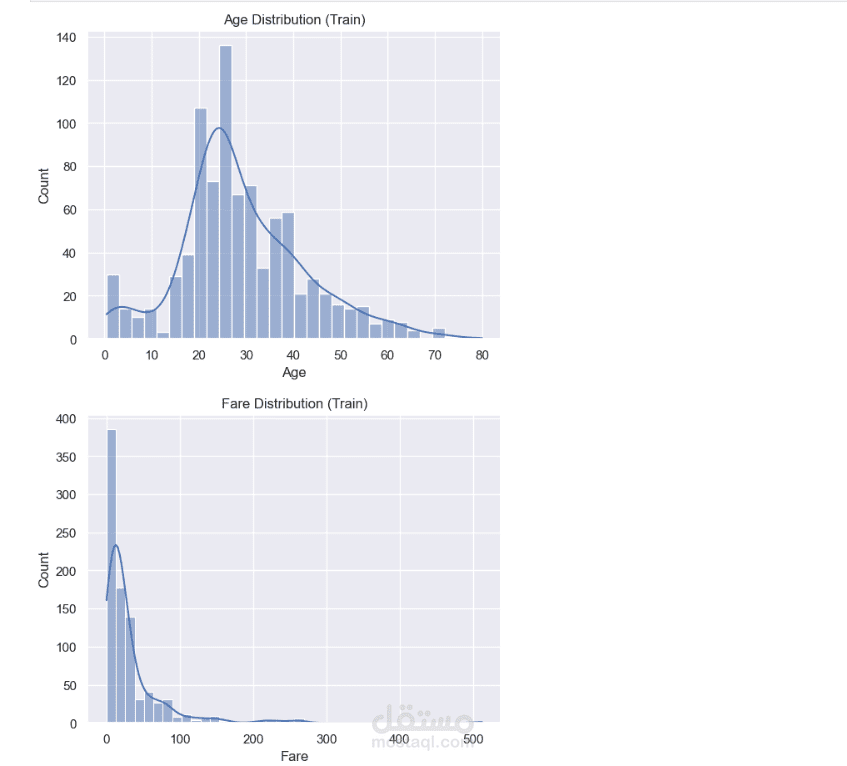
Examine the relationship between age, gender, class, and fare and their effect on survival chances.
Showcase my skills in data processing, feature engineering, and visual analysis.
Deliver actionable insights supported by clear, accurate, and easy-to-understand visualizations.
:Analytical Methods Used
Data cleaning and preprocessing (handling missing values, irregular patterns, and type conversions).
Feature analysis to identify the most significant indicators affecting survival.
Visualization using Matplotlib, Seaborn, and Plotly to display relationships and trends.
Statistical analysis to validate correlations and findings.
Analytical storytelling that connects the numbers to their real-world implications.
:Tools & Techniques
Python (Pandas, NumPy, Matplotlib, Seaborn, Plotly)
Jupyter Notebook
Data visualization and storytelling techniques
:Key Findings
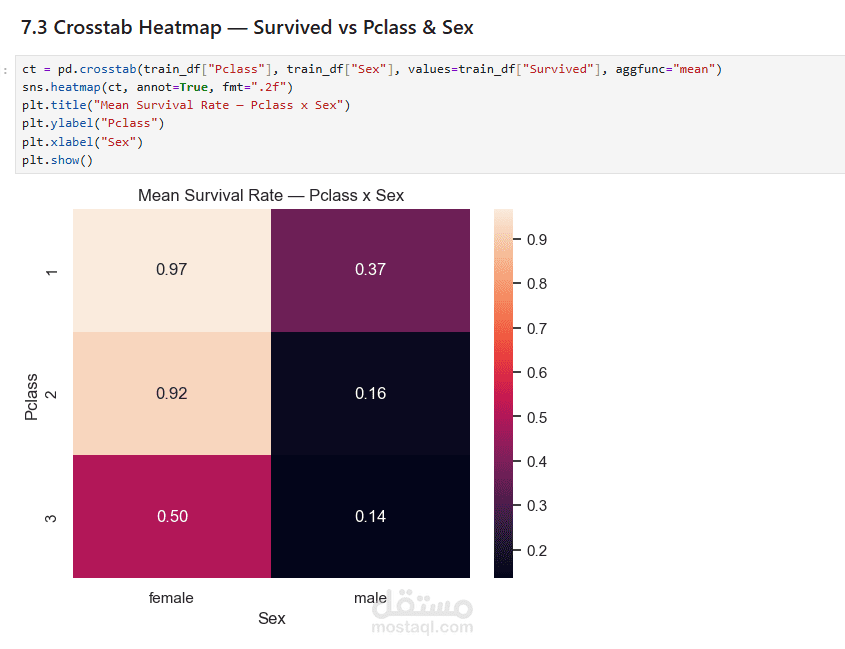
Women and children had the highest survival rates.
First-class passengers had significantly higher chances of survival.
Social class and economic status directly affected likelihood of rescue.
Fare and age showed a strong relationship with survival rates.
:Final Outcome
This project reflects a combination of technical skill and analytical thinking, demonstrating a strong ability to turn data into a clear, digital narrative.