Employee Tracking System
تفاصيل العمل


Employee Tracking System Dashboard Project
As part of my in Data Analysis, I recently worked on a real-world dataset from an employee tracking system used by a company to monitor performance, activity levels, and productivity trends.
The dataset included detailed activity logs, timestamps, and app usage data but it required significant cleaning and transformation before it could generate reliable insights.
Using Python libraries (Pandas and NumPy), I performed the following preprocessing steps:
-Corrected and aligned some fields to calculate accurate durations.
-Handled missing values using median/mode strategies.
-Created new calculated columns for accuracy.
-Validated data consistency and removed duplicates or corrupted entries.
-Once the data was ready, I used DAX measures in Power BI to calculate key insights such
After preparing the data, I built Power BI dashboard consisting of four pages:
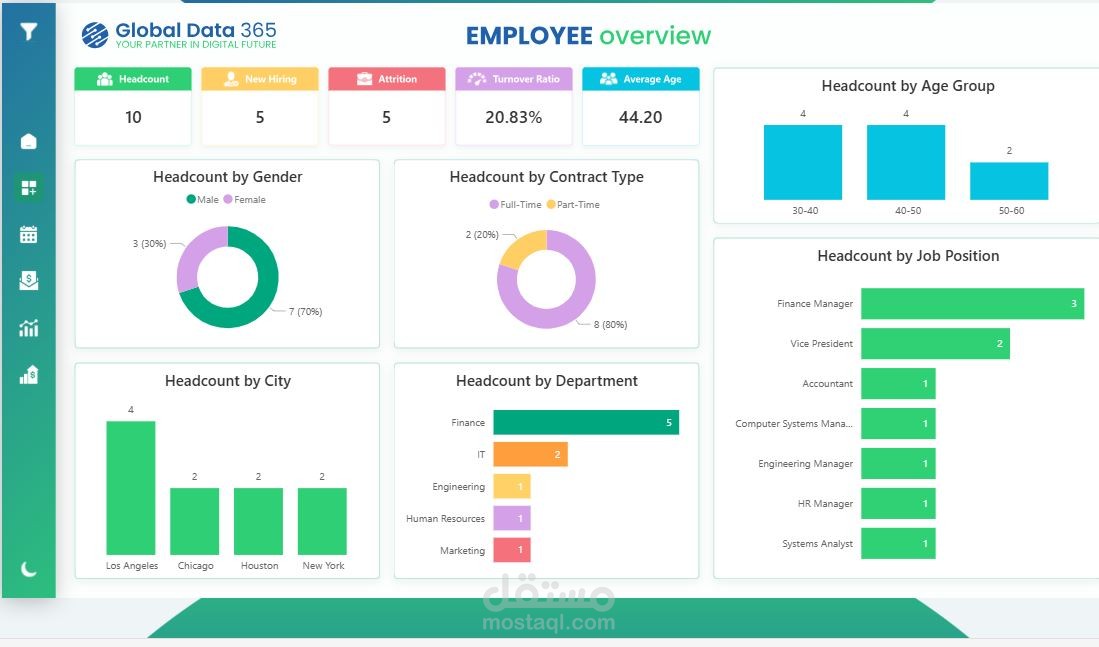
1-Activity Overview:
Displays total activities, total duration, average daily activity, and trends across shifts, weekdays, and months.
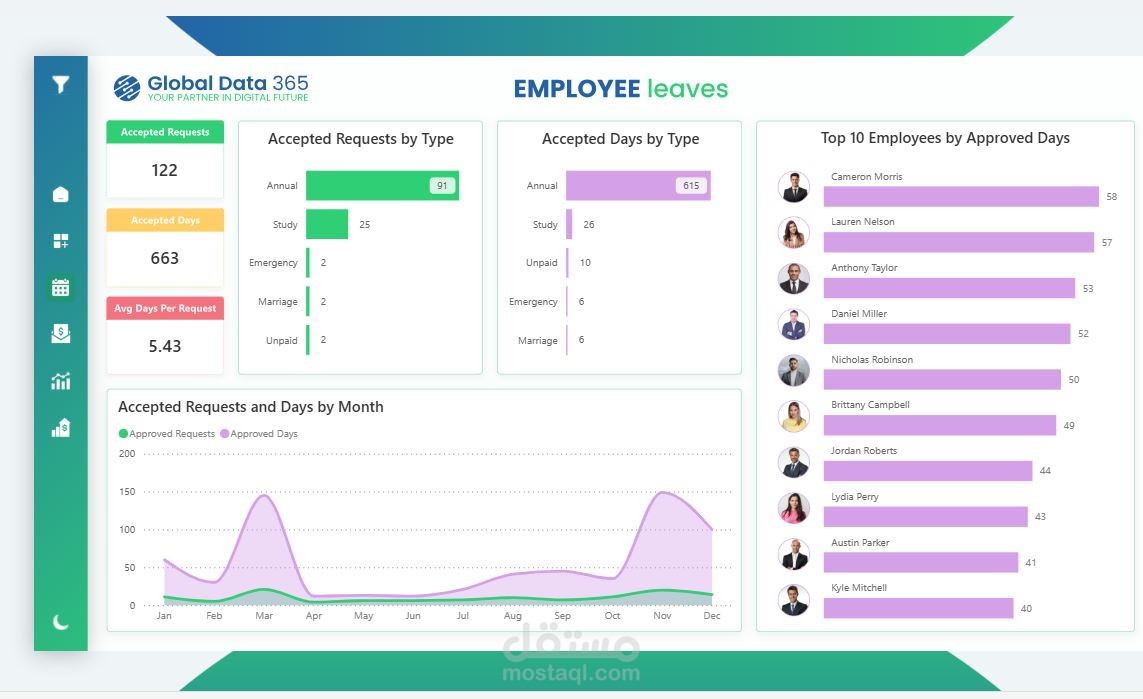
2-Activity Levels:
Visualizes user and project activity intensity by month and shift, identifying engagement patterns.
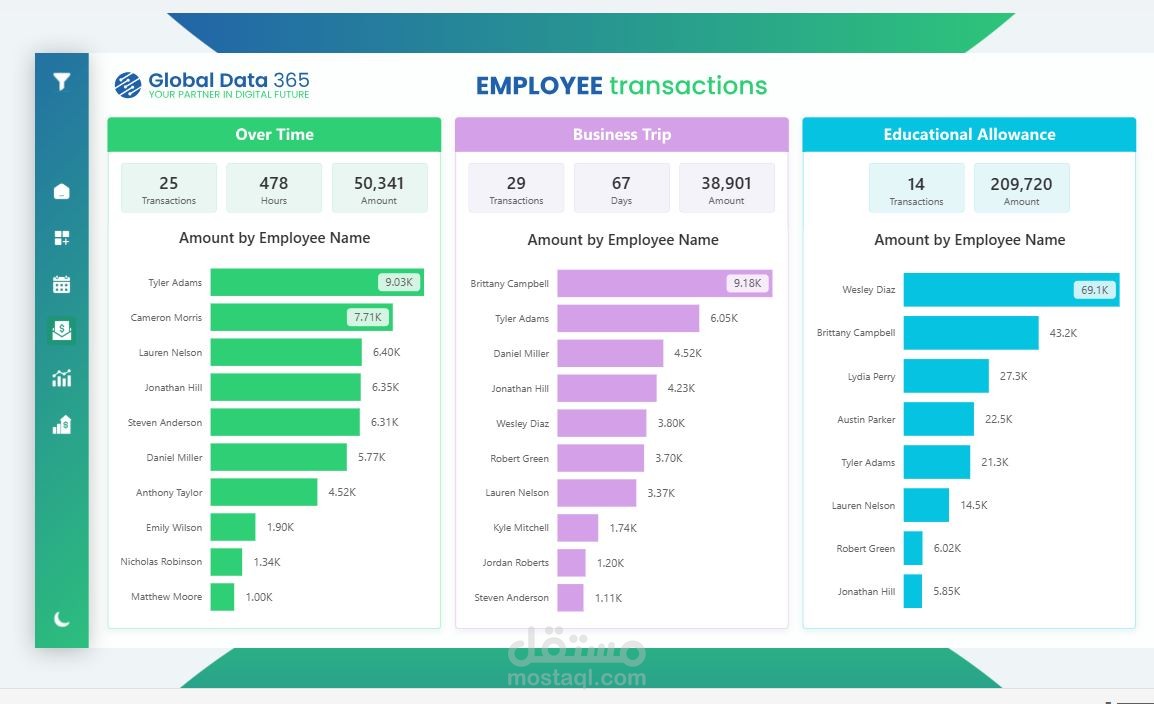
3-Employee Performance:
Highlights each employee’s total working hours, active projects, and average daily performance.
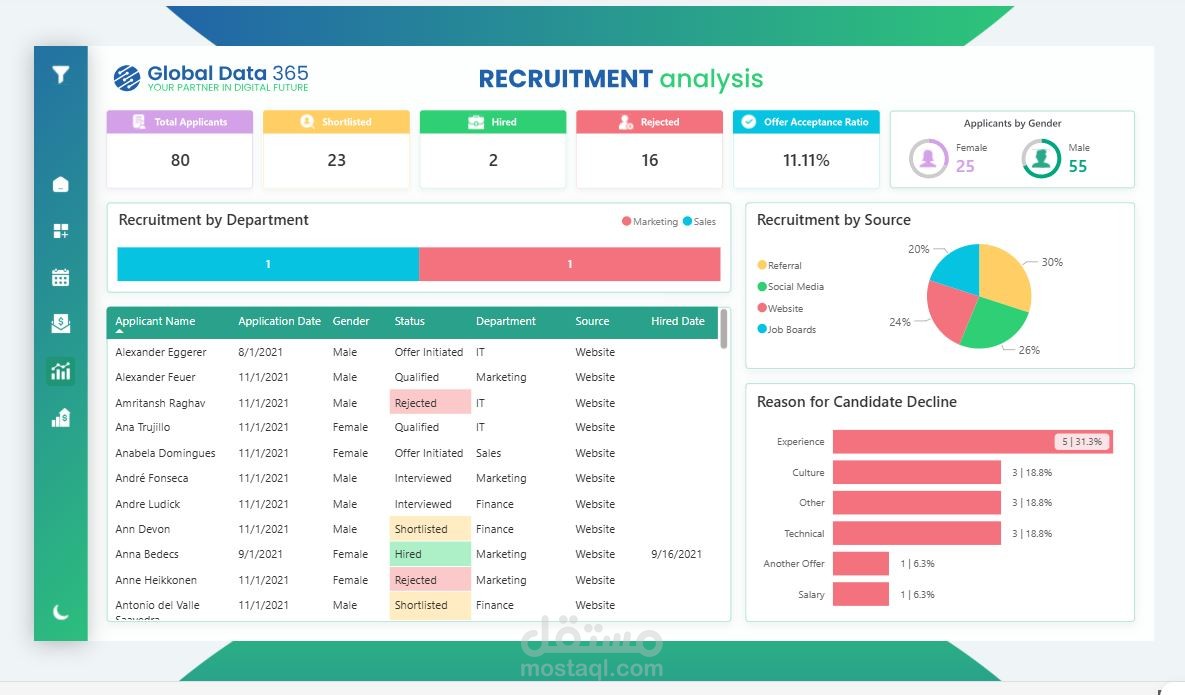
4-Project Insights:
Showcases the top used applications, most active projects, and activity distribution across categories.
The dashboard is fully interactive, allowing users to apply filters on each page through dedicated filter buttons and navigate seamlessly between pages using sidebar icons for a smooth experience.
This project allowed me to apply data wrangling, DAX calculations, and dashboard storytelling to real operational data transforming raw activity logs into actionable insights for management and decision-making.