Cafe Sales Analysis
تفاصيل العمل
The dataset simulated Cafe transactions and was far from clean it included missing values, inconsistent data types, and errors in quantity and price fields.
I used Python (mainly Pandas and NumPy) to clean and prepare the data by:
Handling null and NaN values using median and mode replacements.
Converting incorrect data types (such as quantity and prices stored as text).
Fixing outliers and calculating new columns like Total Spent and Revenue Category.
Storing the cleaned dataset in a copy to ensure the original data remained intact.
After cleaning, I imported the data into Power BI to build two interactive dashboards:
Overview Dashboard showing Total Revenue, Quantity Sold, Transactions, and Average Order Value.
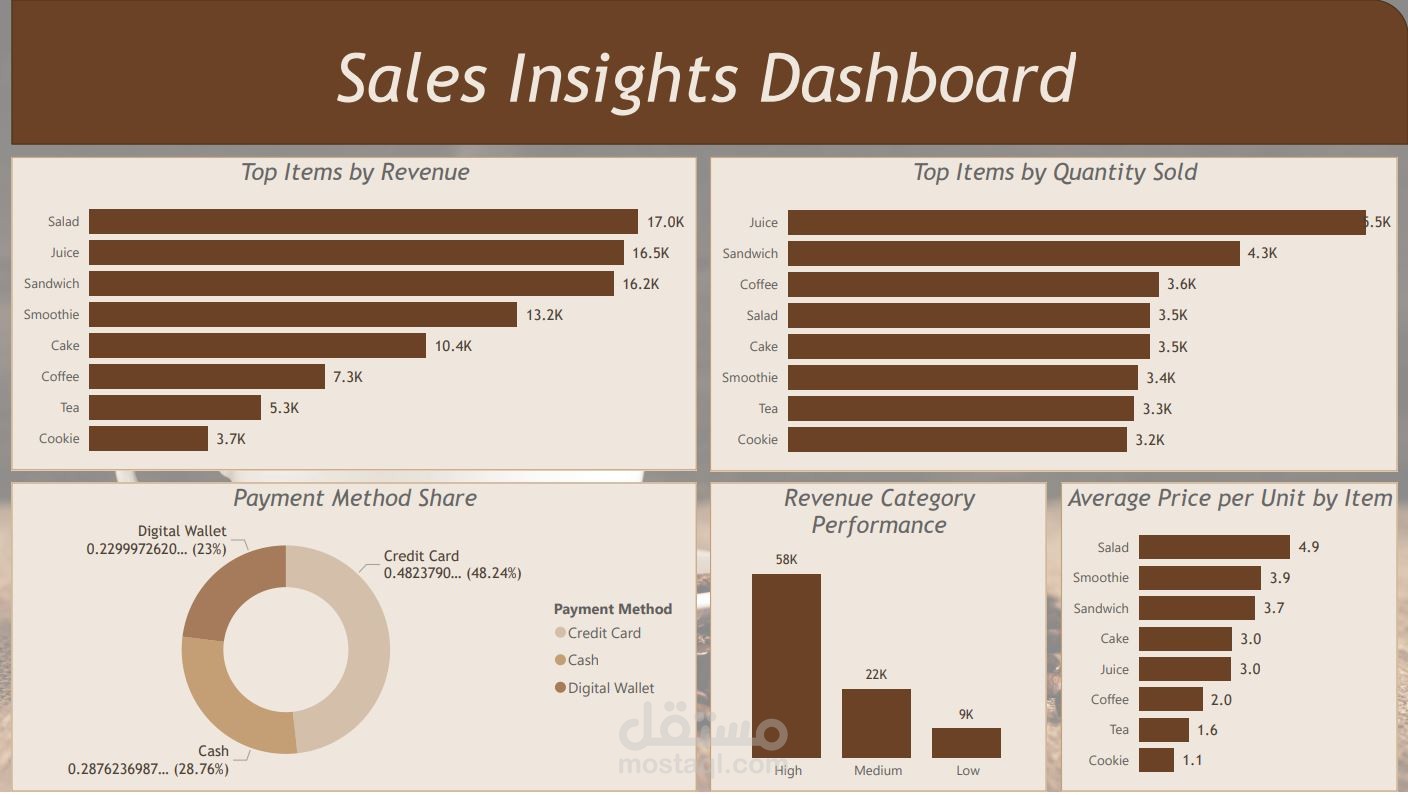
Sales Insights Dashboard highlighting top-selling items, average price per unit, payment methods, and revenue category performance.
I also used a warm coffee-inspired color palette to reflect the cafe’s identity and make the visuals consistent and easy to read.
This project helped me strengthen my data wrangling, cleaning, and visualization skills transforming messy raw data into clear, actionable insights.