Olympic-Games-Dashboard
تفاصيل العمل
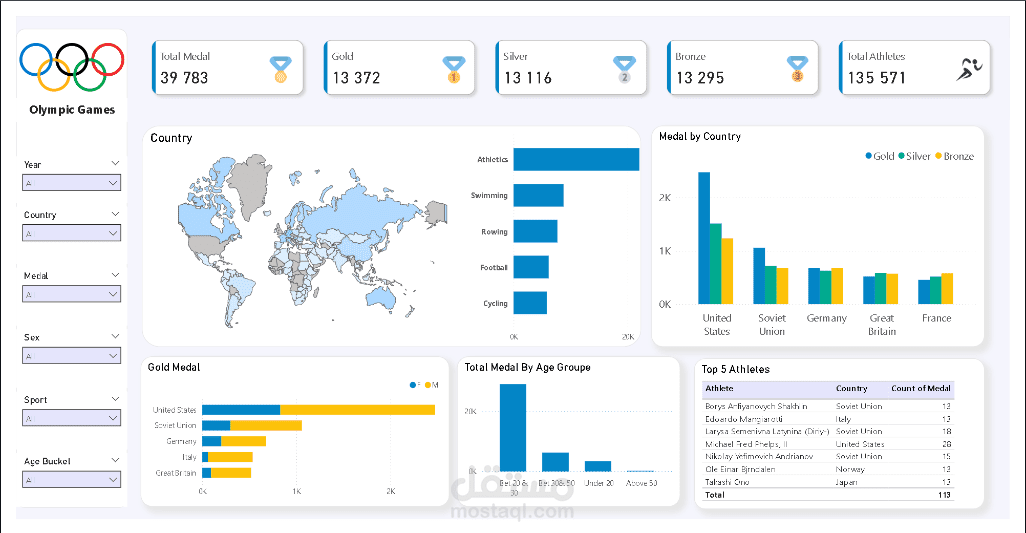
This Power BI Dashboard provides an interactive analysis of Olympic Games data. It highlights the distribution of medals, top-performing countries, athlete demographics, and medal trends. The goal is to visualize Olympic history and identify performance patterns across countries, sports, and age groups.