Revenue, Cost, and Product Quality Overview
تفاصيل العمل
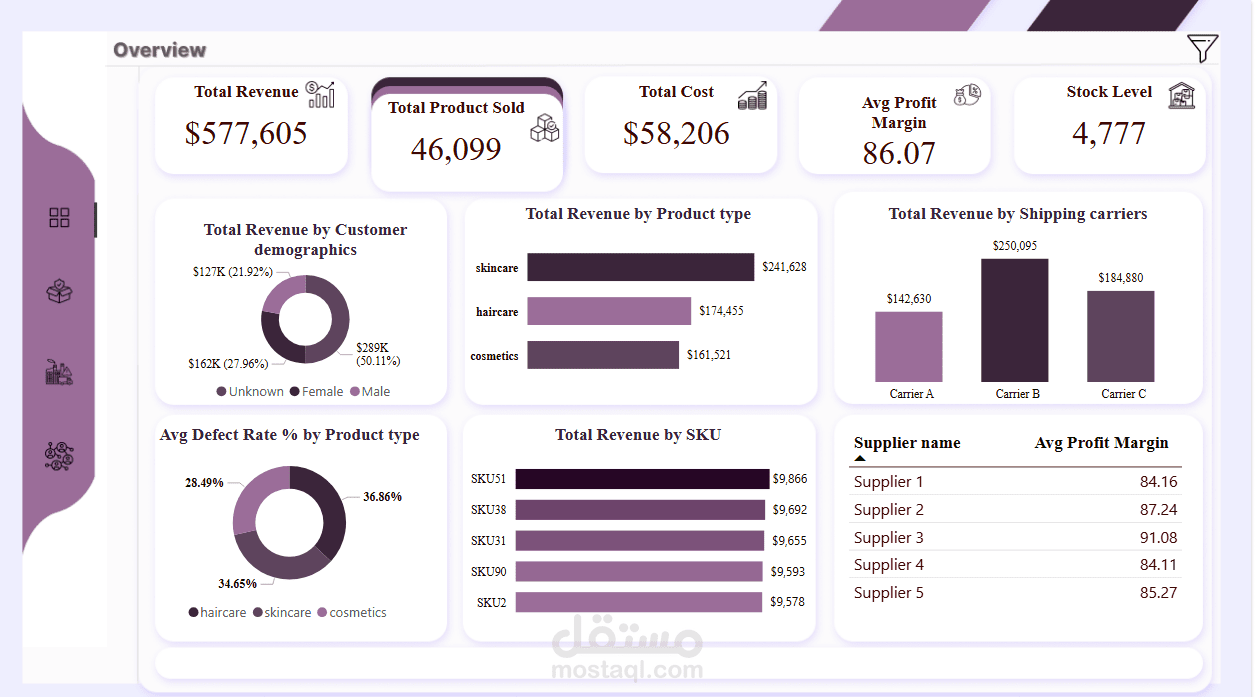
This is a comprehensive operational and financial dashboard focused on products and the supply chain. It provides insights into revenue, costs, profit margins, inventory levels, and product quality (defect rate), supporting pricing and supplier management decisions.
Key Performance Indicators (KPIs) at the Top:
Total Revenue: $577,605
Total Product Sold: 46,099
Total Cost: $58,206
Avg Profit Margin: 86.07% (Indicates high profitability)
Stock Level: 4,777
Detailed Visualizations:
Total Revenue by Customer Demographics: Shows that Female customers contribute the highest revenue share (30.11%), followed by Male customers (29.2%).
Total Revenue by Product Type: Skincare products generate the highest revenue ($241,628), followed by haircare, then cosmetics.
Total Revenue by Shipping Carriers: "Carrier B" is responsible for the highest shipping-related revenue ($290,095).
Avg Defect Rate % by Product Type: Reveals that cosmetics have the highest average defect rate (36.86%), followed by haircare (34.65%).
Total Revenue by SKU and Supplier Name:
Products (SKU): Lists the top products by SKU based on revenue.
Suppliers: Shows the average profit margin per supplier, with Supplier 3 having the highest margin (91.08).
Extracted Skills:
Profitability and Cost Analysis: Evaluating product financial performance and identifying high-margin items.
Inventory and Supply Chain Management: Monitoring stock and assessing the performance of suppliers and carriers.
Quality Control: Analyzing defect rates to pinpoint areas needing process improvement (e.g., focusing on cosmetics to reduce defects).
Operational Intelligence: Understanding how different operational components (shipping, suppliers) impact the overall financial picture.