business understanding and cleaning and visualization using python
تفاصيل العمل
Project: Data Analysis
Business Understanding: Examined the dataset to identify key objectives and insights. Defined analysis goals, including trends, patterns, and potential areas for improvement.
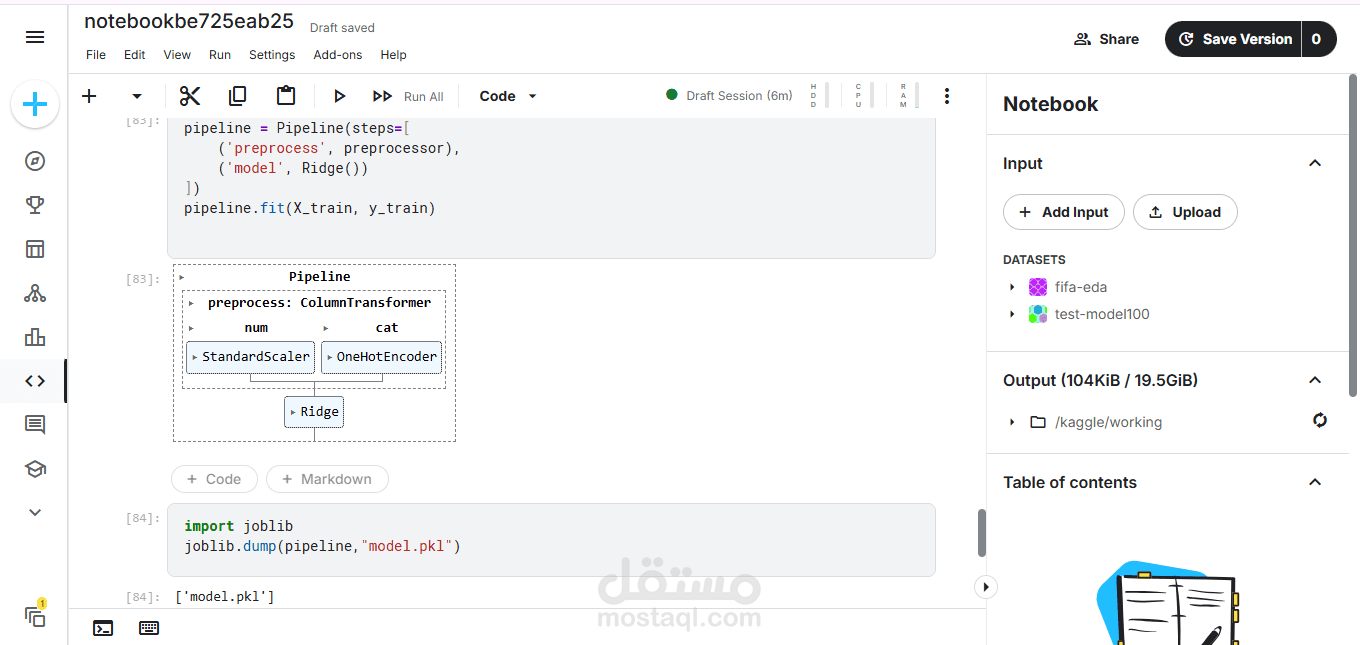
Data Cleaning: Processed and cleaned the data to handle missing values, duplicates, and inconsistencies, ensuring accuracy and reliability.
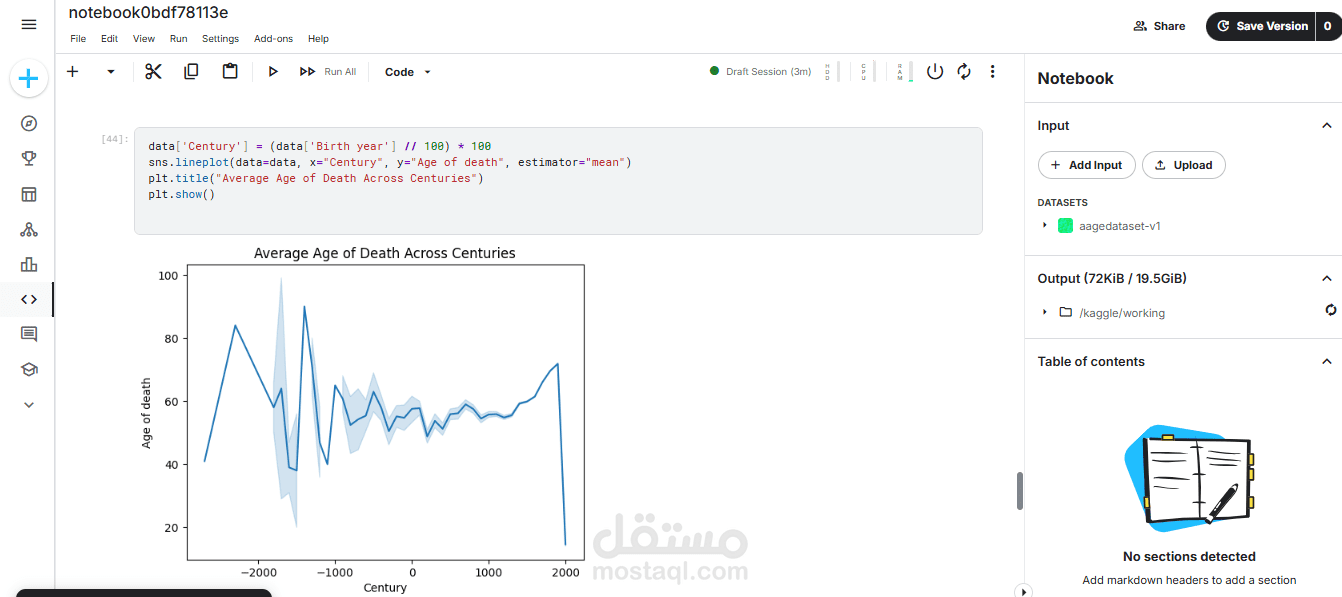
Data Visualization: Created clear and informative visualizations using Python (Matplotlib/Seaborn) or Excel to illustrate trends, comparisons, and key metrics, effectively communicating insights.
Outcome: Produced a well-structured analysis demonstrating ability to understand business problems, clean and organize data, and present insights visually to support decision-making.