تحليل بيانات
تفاصيل العمل
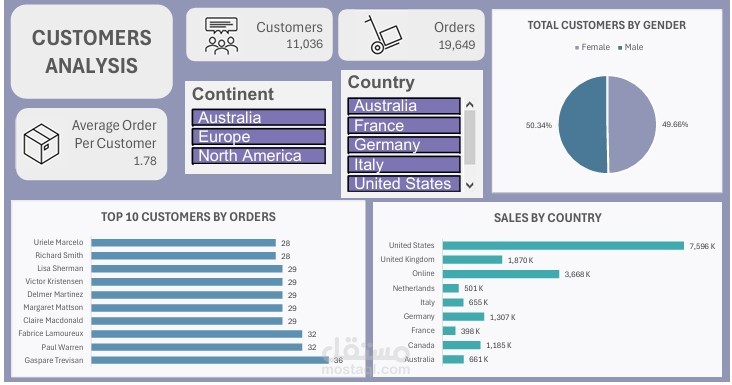
This project focuses on transforming raw data into meaningful insights that support better business decisions.
Through data cleaning, exploration, and visualization, I identified key trends, performance patterns, and improvement opportunities across different areas of the business.
Key Objectives:
Understand overall performance and profitability.
Identify top-performing categories, products, or departments.
Detect underperforming areas that may need optimization.
Track growth trends and changes in demand over time.
Tools Used:
Excel / Power BI / Python / Tableau
Outcome:
The analysis resulted in clear visual reports and data-driven insights that help stakeholders make informed, strategic decisions and enhance overall efficiency and performance.