تحليل البيانات
تفاصيل العمل
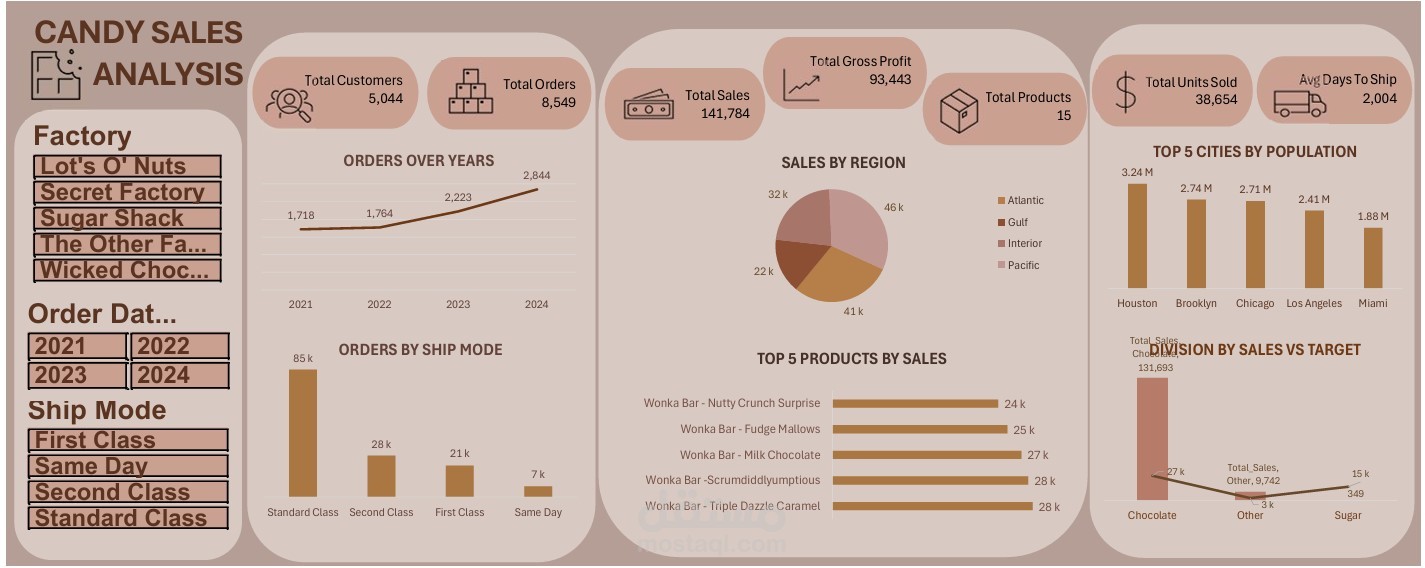
In this project, I conducted a detailed analysis of the company’s sales and profit data to identify key revenue drivers and areas that require performance improvement.
Key Insights:
The Chocolate Division drives the majority of the company’s profit, contributing around 95% of total gross profit.
The Sugar Division shows very low profitability — indicating the need for a product or pricing review.
Top-performing products such as Triple Dazzle Caramel and Milk Chocolate are the biggest contributors to total revenue.
Lot’s O’ Nuts and Wicked Choccy factories generate the highest sales, while Sugar Shack shows weak performance and needs optimization.
Order volume has grown steadily over the years, reflecting increasing demand and strong market potential.
Tools Used:
Excel / Power BI / Python
Outcome:
Raw data was transformed into clear analytical insights and interactive visual dashboards, helping to support data-driven decisions and improve overall business performance.