Sales Data Analysis using Python and SQL
تفاصيل العمل

Project Description
This project analyzes sales performance data using Python for data manipulation and visualization, and SQL for data validation and exploration.
Key Features:
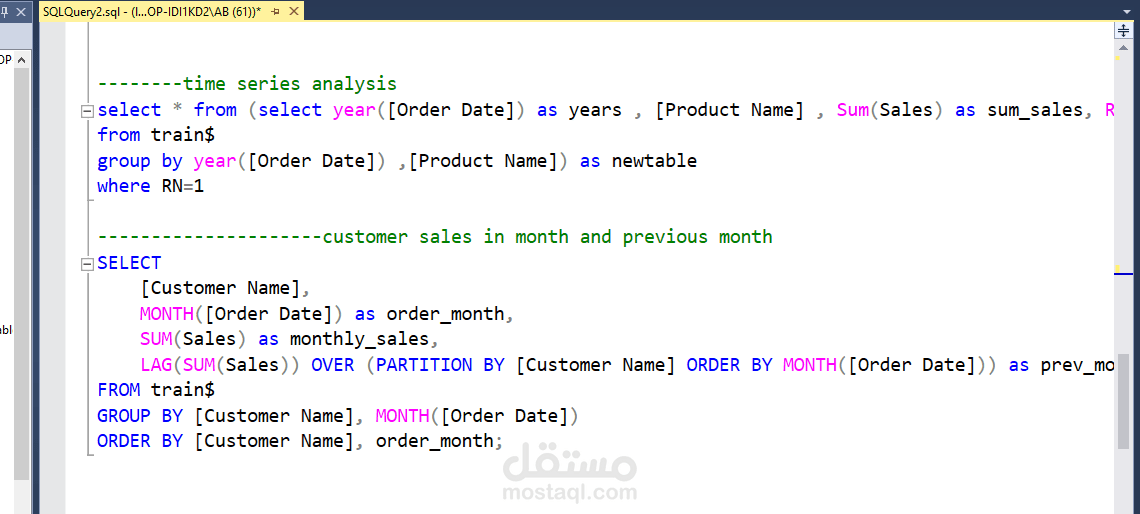
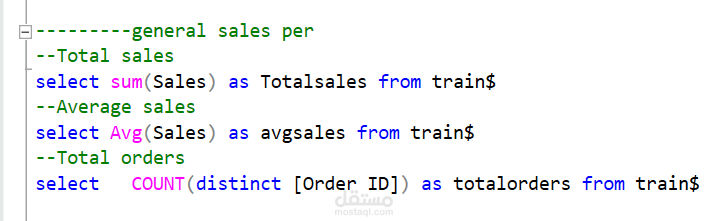
Used SQL to validate data consistency across multiple tables (Sales, Products, Customers).
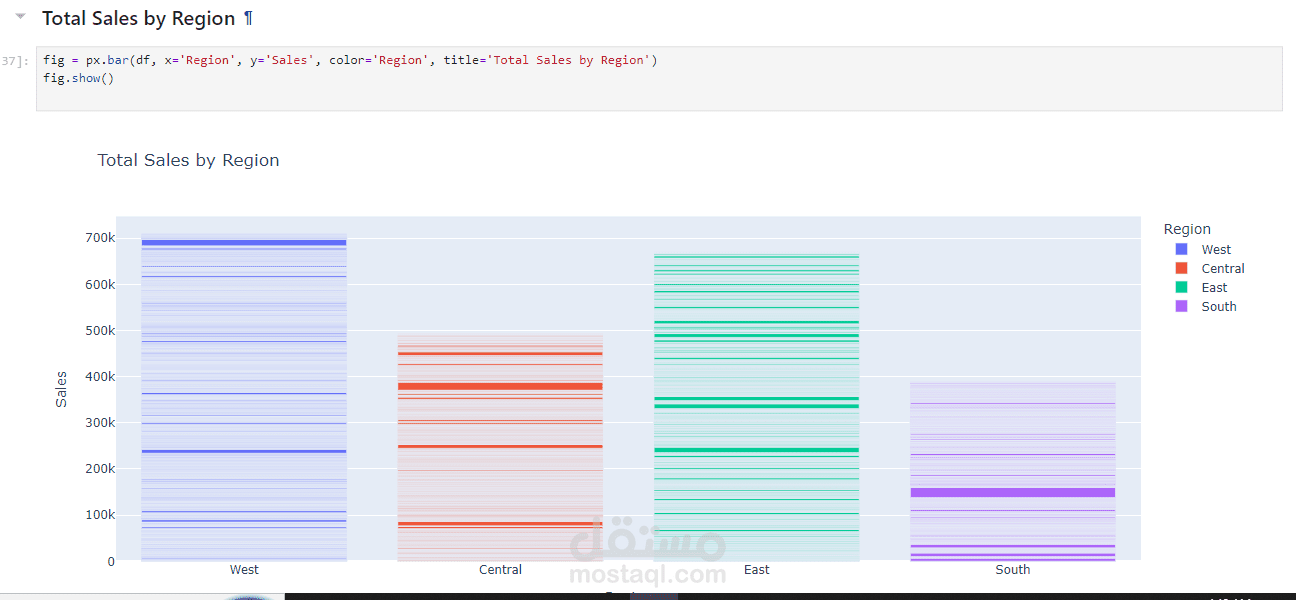
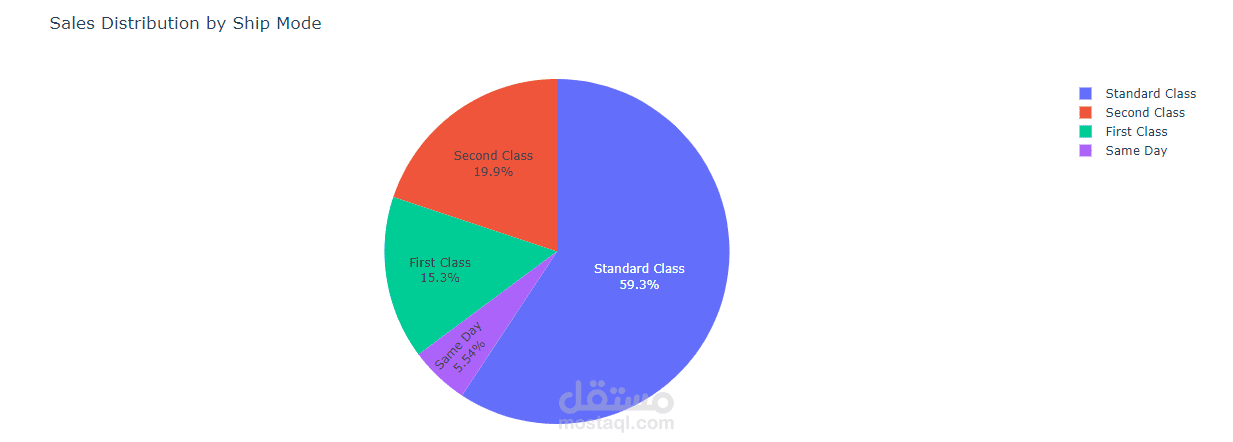
Applied Python (Pandas, Matplotlib, Seaborn) for data cleaning, transformation, and trend visualization.
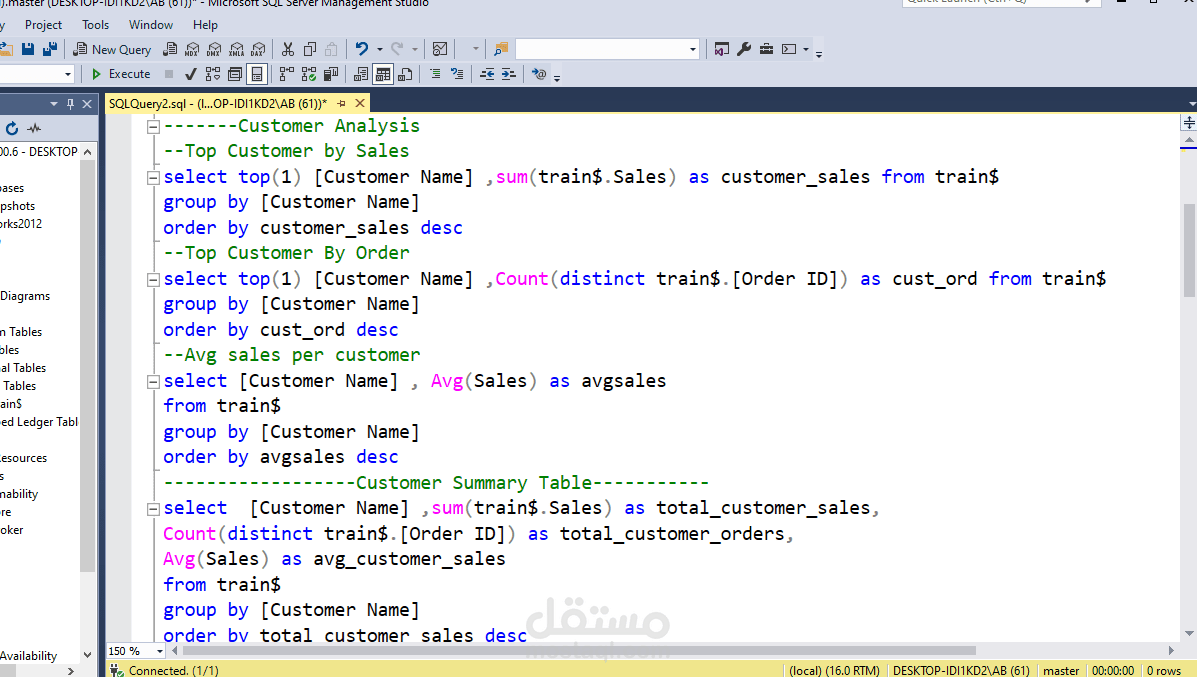
Created KPIs such as total revenue, average sales per customer, and monthly growth rate.
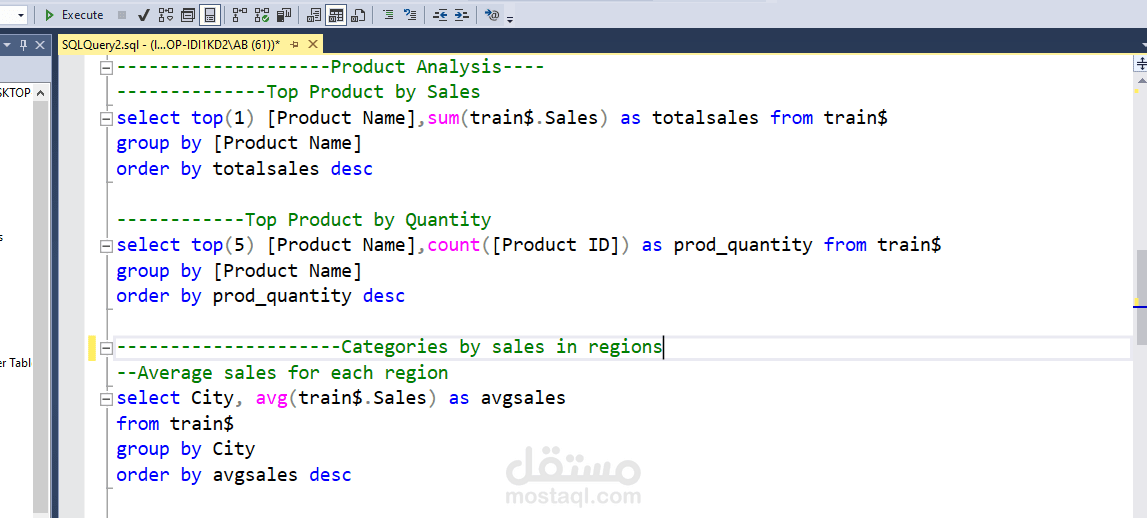
Identified top-performing products, best-selling months, and customer purchase patterns.
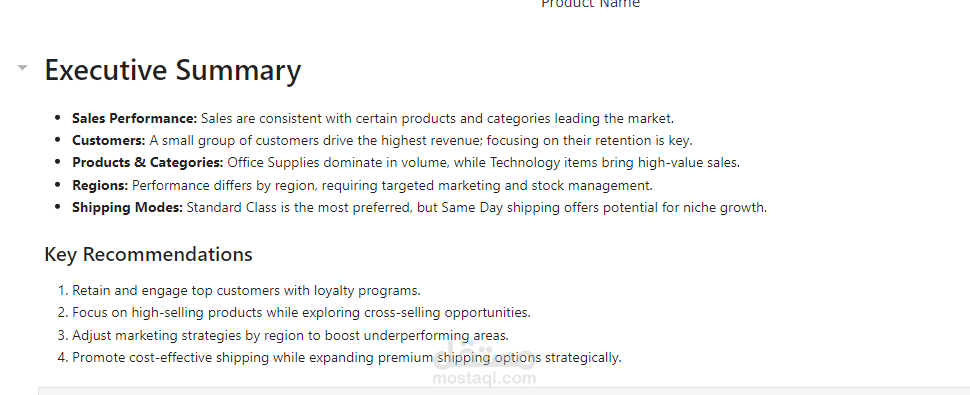
Key Insights:
Sales peaked during specific seasonal periods, indicating strong demand trends.
Certain product categories contributed to more than 60% of total revenue.
The customer segmentation analysis showed that high-value customers made frequent repeat purchases.
Tools Used:
Python (Pandas, Matplotlib, Seaborn)
SQL Server
Jupyter Notebook
This project demonstrates strong analytical and technical skills in data cleaning, visualization, and performance analysis, integrating Python and SQL seamlessly to extract valuable business insights.