Retail Sales Data Cleaning & Simple Dashboard
تفاصيل العمل
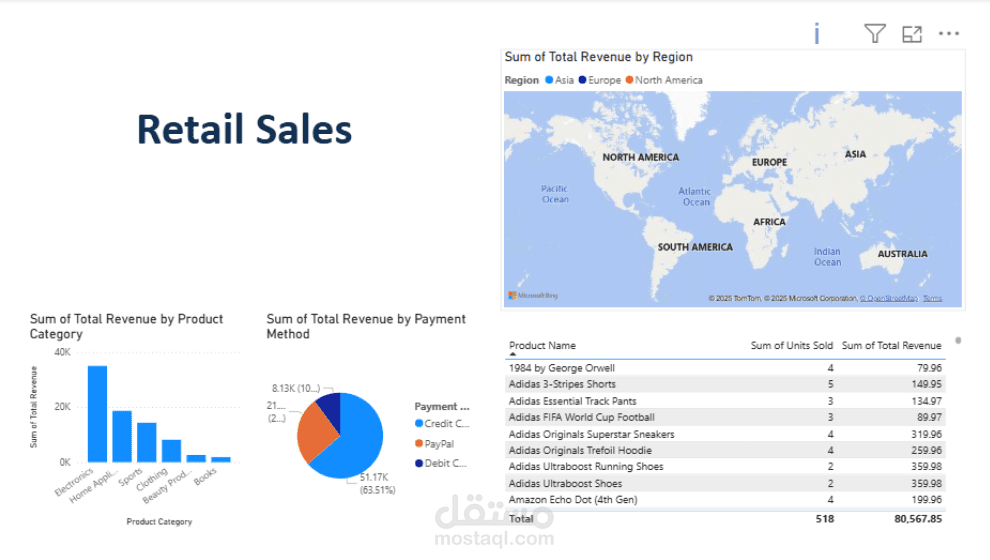
The Retail Sales analysis focuses on examining sales performance across different cities and products to identify trends and support decision-making. The dataset includes transactional information such as total sales amount, sales by city, and sales by product. The data was already clean, with no blank values found, and the existing title was suitable, so no changes were needed. The only adjustment made was changing the data type of the transaction ID to text. Using Power BI, visuals like clustered column charts, stacked column charts, and maps are applied to compare sales distribution, highlight top-performing regions, and monitor product demand. This analysis enables better strategic planning, resource allocation, and targeted marketing efforts to improve overall retail performance.