Retail and Sales Analysis
تفاصيل العمل
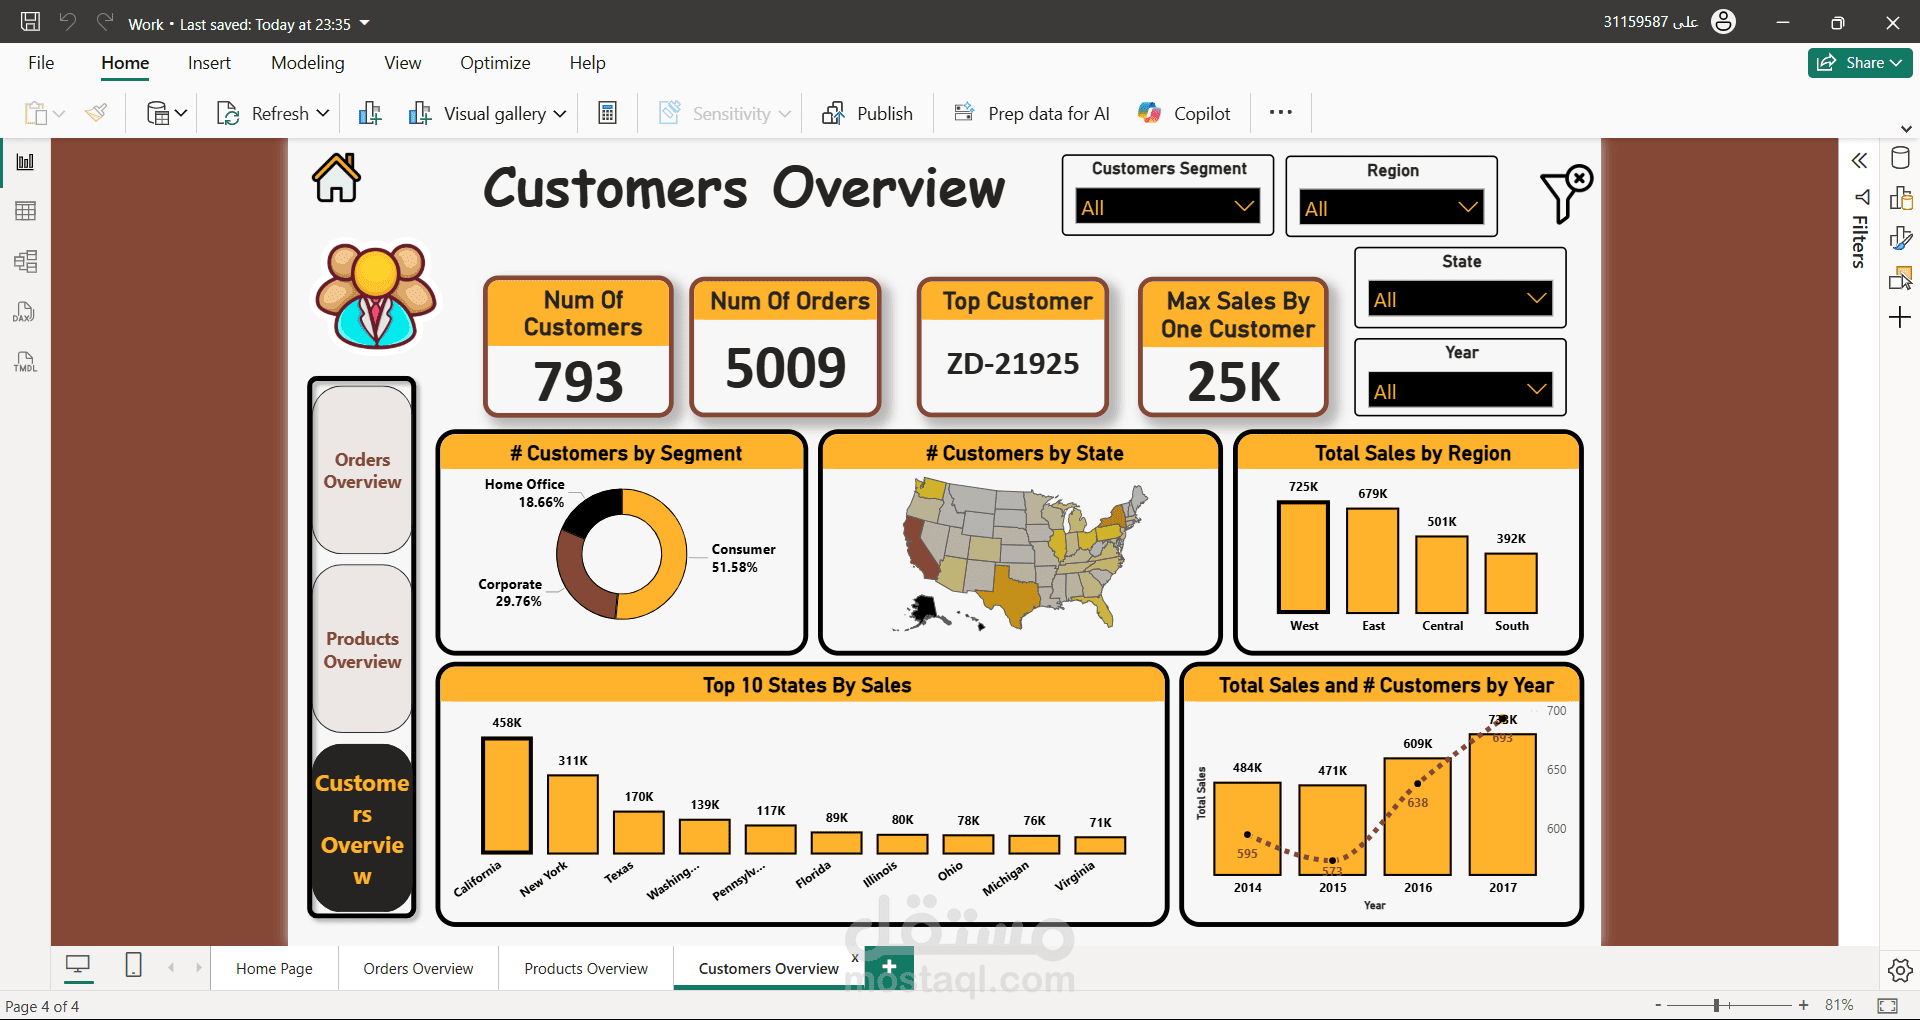
Retail Analysis Dashboard | Power BI Project
This project showcases a Retail Analysis Dashboard built entirely in Power BI using Power Query for data cleaning and transformation.
The dashboard provides interactive insights into sales, customers, and product performance, helping businesses track KPIs, identify trends, and make data-driven decisions.
Key highlights include:
Dynamic filtering by category, segment, and time period
Sales & profit trend analysis
Customer segmentation and top-performing products
Geographical performance visualization
Built with a star schema model for optimized performance and clear data relationships, this project demonstrates strong skills in data modeling, visualization, and business insight creation.
Let’s work together to turn your raw data into powerful insights!