Adidas Sales Dashboard (Power BI)
تفاصيل العمل
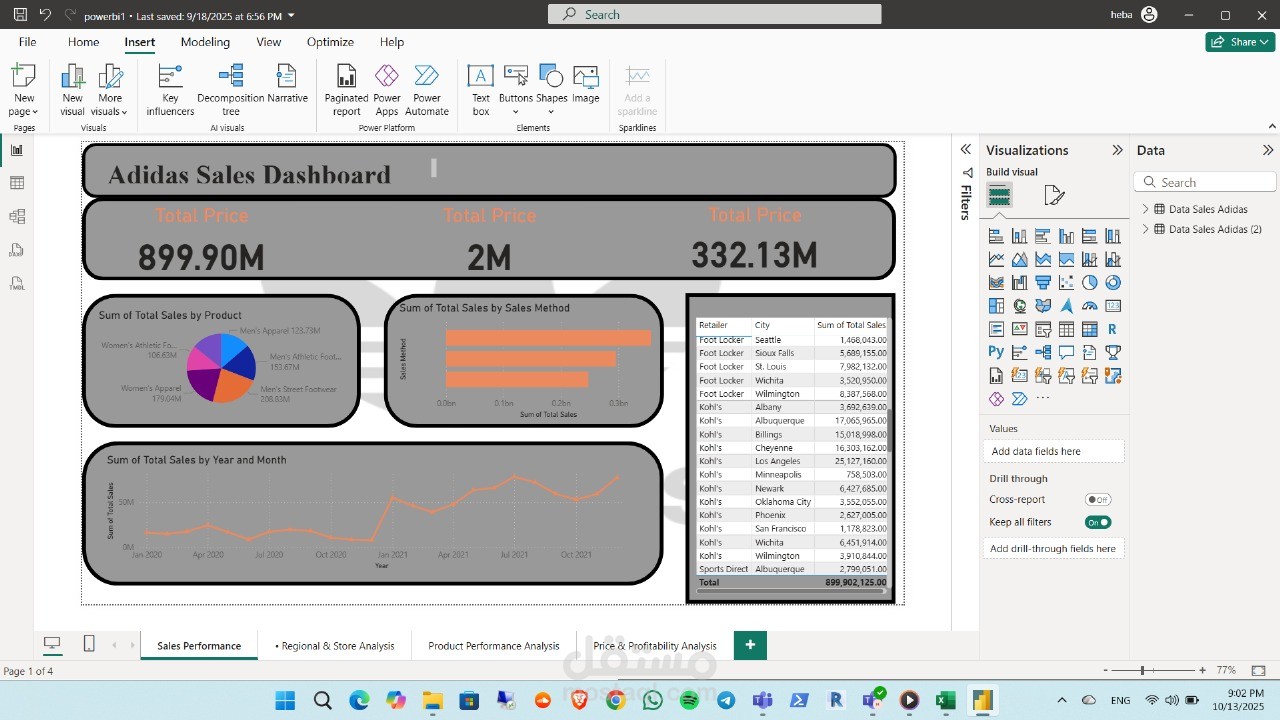
This interactive dashboard visualizes Adidas sales performance across products, regions, and time periods.
It includes KPIs such as Total Sales, Sales by Product Category, Sales by Method, and Monthly Trends.
The dashboard enables quick insights into sales distribution and top-performing regions or retailers.
Tools used: Microsoft Power BI, Data Modeling, DAX, Data Visualization