Life Expectancy Trend Analysis (Python – Jupyter Notebook)
تفاصيل العمل
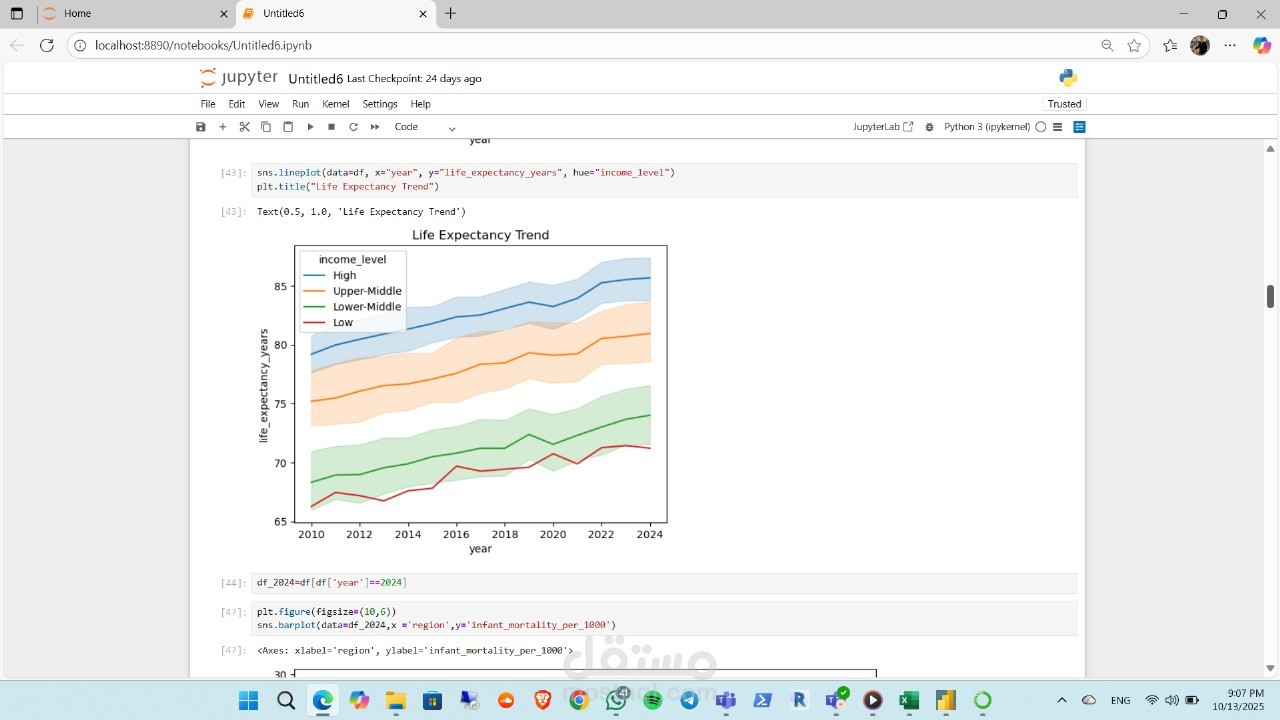
This project analyzes global life expectancy trends between 2010 and 2024 using Python, Pandas, and Seaborn.
It visualizes how life expectancy changes across different income levels (High, Upper-Middle, Lower-Middle, and Low) countries.
The line plot highlights the positive correlation between income and life expectancy, showing that higher-income countries tend to have better health outcomes.
Tools used: Python, Pandas, Seaborn, Matplotlib, Jupyter Notebook