Multiple Chart Visualizations in Tableau Using Superstore Dataset
تفاصيل العمل
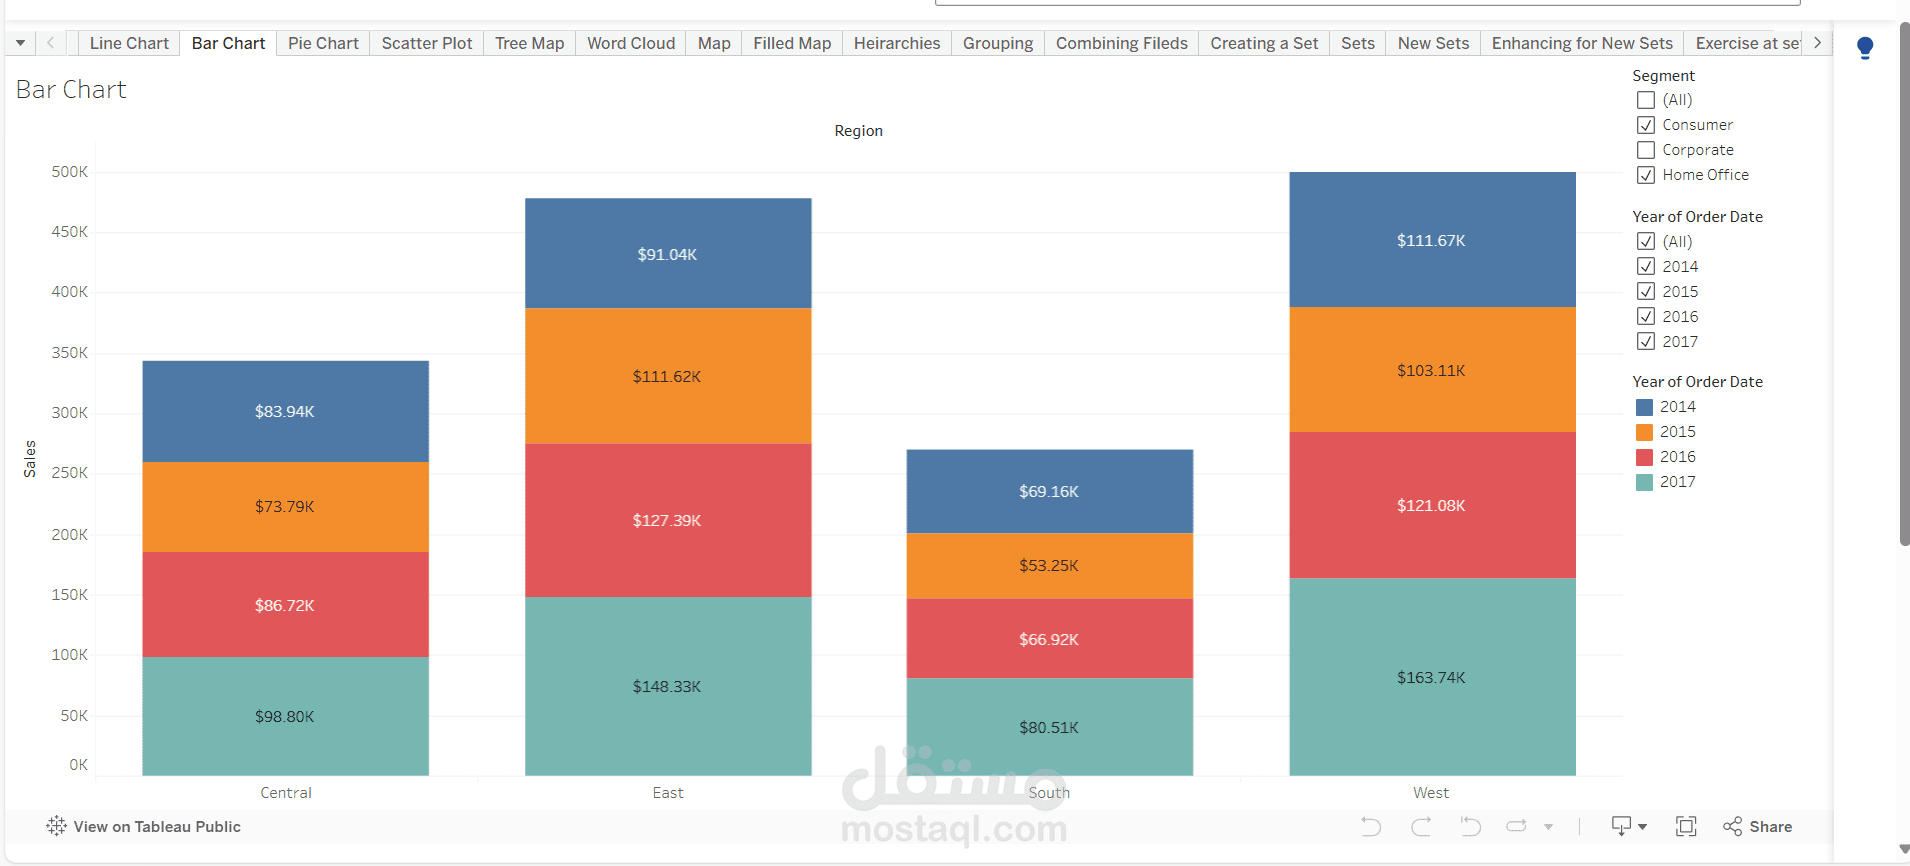
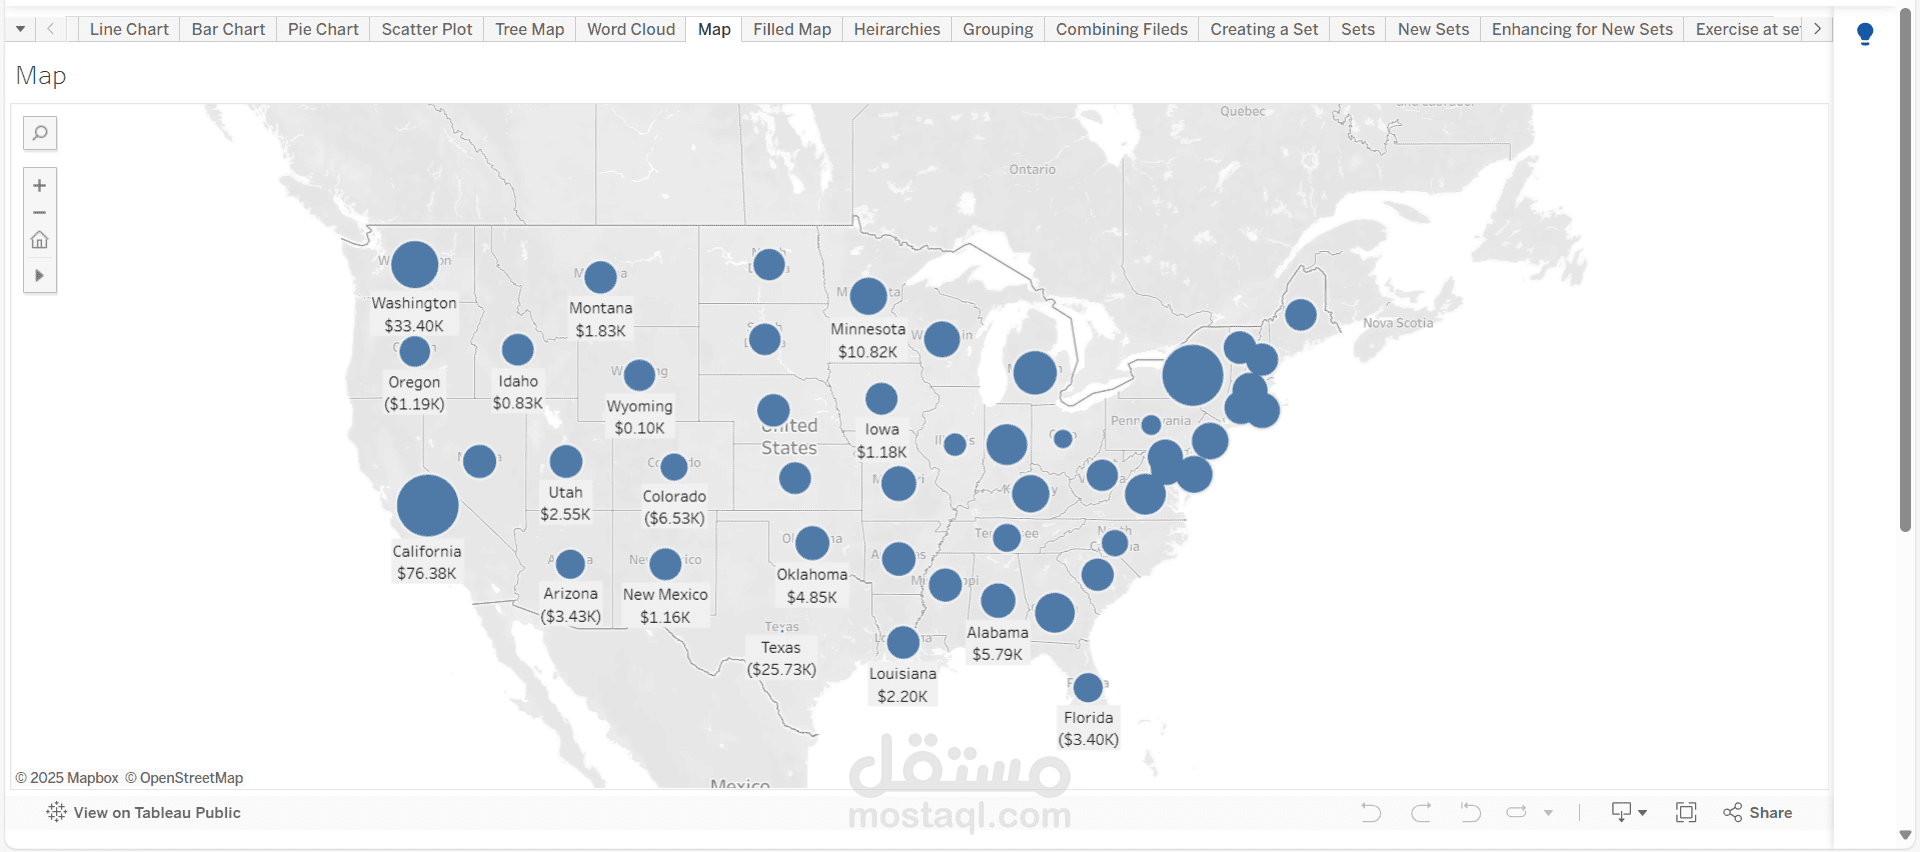
In this project, I used Tableau to analyze the Superstore dataset by creating a variety of visualizations, including
Bar Charts
Pie Charts
Line Graphs
Category, Region, and Time-based analysis
The goal of this work was to demonstrate the wide range of data visualization capabilities in Tableau, using dynamic filters, interactive elements, and clear visual storytelling to explore and present key business insights