Institution Sales Report
تفاصيل العمل
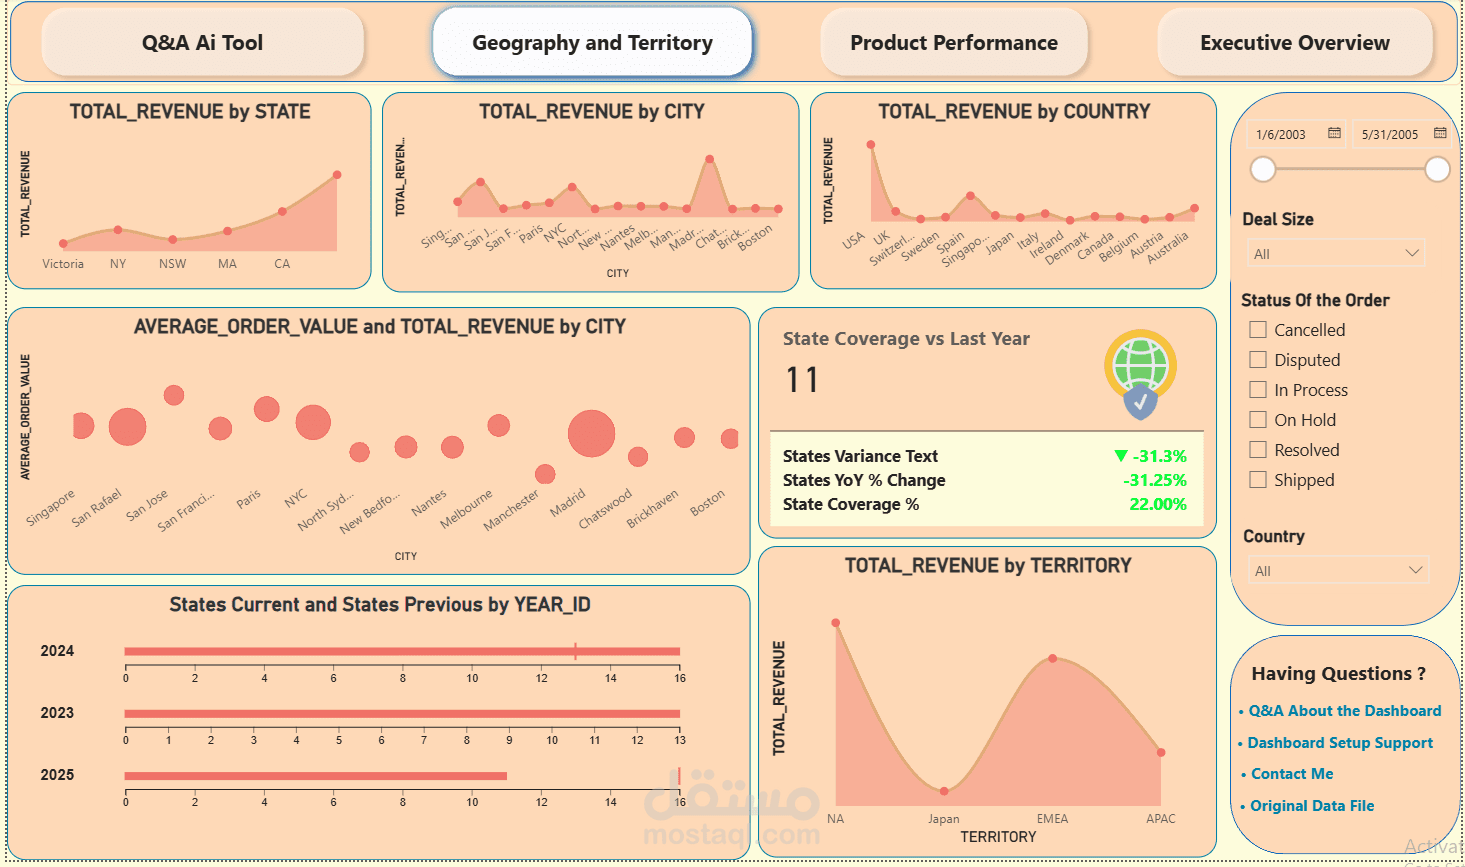
I designed and developed an interactive Power BI dashboard to analyze company sales performance across multiple dimensions — products, customers, and regions.
The report highlights:
Sales Overview: Key performance indicators (total sales, orders, and customers) with trend analysis over time.
Customer Insights: Repeat purchase behavior, customer segmentation by deal size, and top revenue-generating accounts.
Product Analysis: Performance comparison by product line, order status, and profitability trends.
Geographic Insights: Regional and country-level breakdowns, with dynamic slicers for year, product line, and deal size to explore sales patterns.
I used DAX measures to create advanced calculations, such as:
Year-over-Year sales growth
Average deal size
Customer repeat purchases
Dynamic profit and sales measures
This project demonstrates how raw sales data can be transformed into clear, actionable insights with an attractive design, slicers for interactivity, and drill-through capabilities.