Sales & Operations Performance Dashboard
تفاصيل العمل
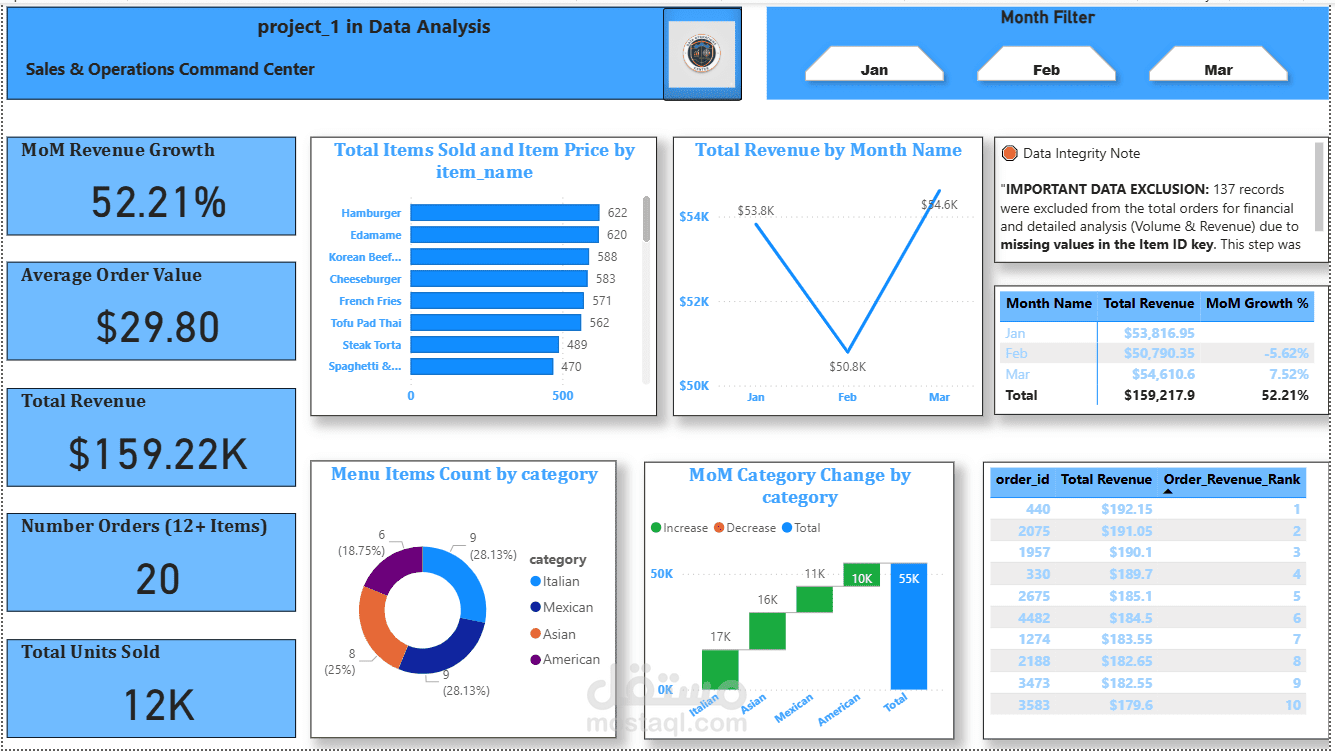
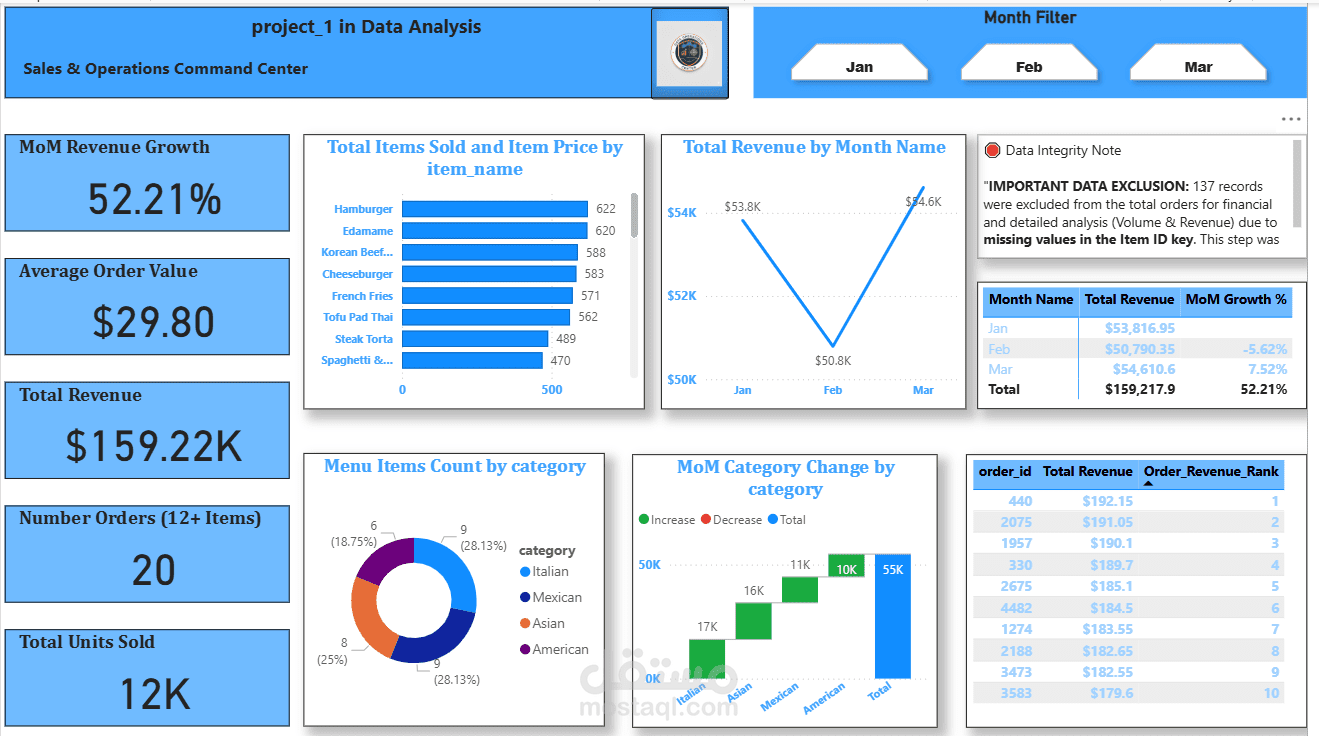
Developed a comprehensive and interactive Power BI dashboard to analyze sales and operations performance. This project aims to provide actionable, data-driven insights for businesses to better understand their sales trends and optimize operations.
Key Features:
- Comprehensive Analytics: Tracks vital KPIs such as MoM Revenue Growth, Average Order Value, Total Revenue, Number of Orders, and Total Units Sold.
- Visual Insights: Utilizes various charts (bar charts, line graphs, pie charts, waterfall charts) to illustrate monthly revenue trends, item-level sales, category distribution, and month-over-month category changes.
- User-Friendly Design: Features a clean, professional, and intuitive interface that simplifies data exploration.
- Data Transparency: Includes a 'Data Integrity Note' to highlight any data limitations or important considerations.
Tools Used: Power BI, Excel, Power Query.,DAX