Automated Financial Report-Dashboard
تفاصيل العمل
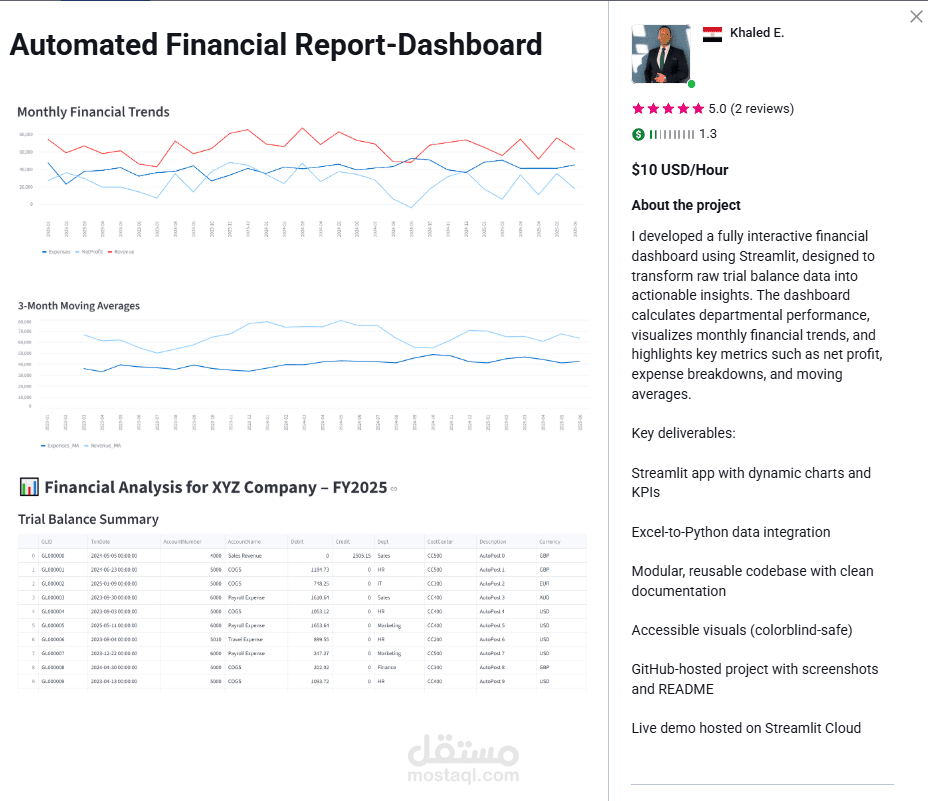
I developed a fully interactive financial dashboard using Streamlit, designed to transform raw trial balance data into actionable insights. The dashboard calculates departmental performance, visualizes monthly financial trends, and highlights key metrics such as net profit, expense breakdowns, and moving averages.
Key deliverables:
Streamlit app with dynamic charts and KPIs
Excel-to-Python data integration
Modular, reusable codebase with clean documentation
Accessible visuals (colorblind-safe)
GitHub-hosted project with screenshots and README
Live demo hosted on Streamlit Cloud