Sales Dashboard
تفاصيل العمل
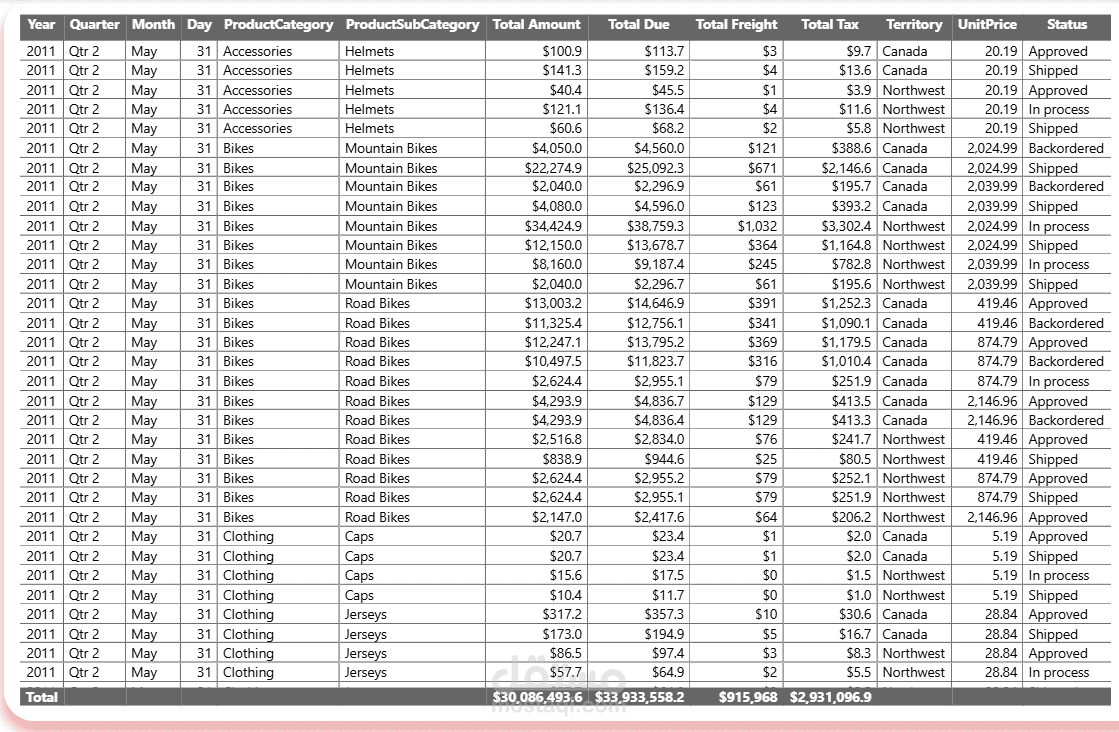
I handled everything — from data cleaning and analysis to designing the final dashboard in Power BI.
Here are some key insights from the dashboard:
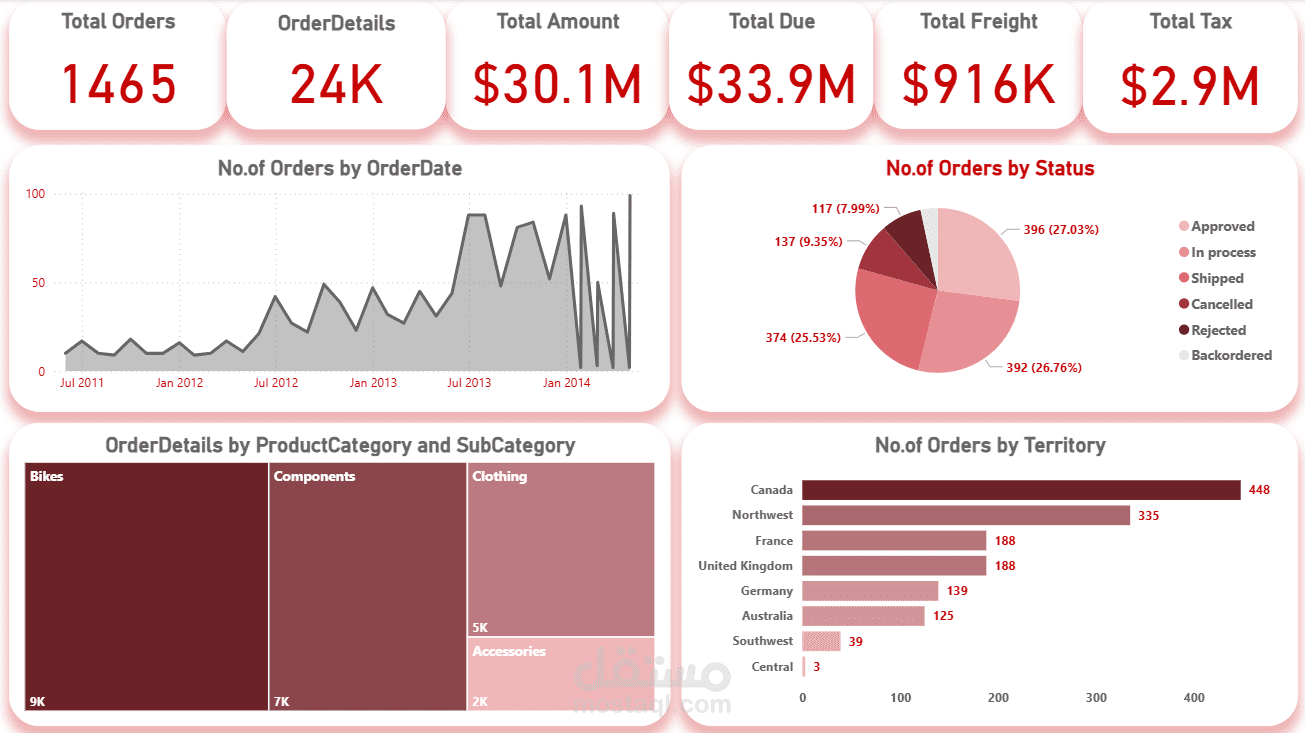
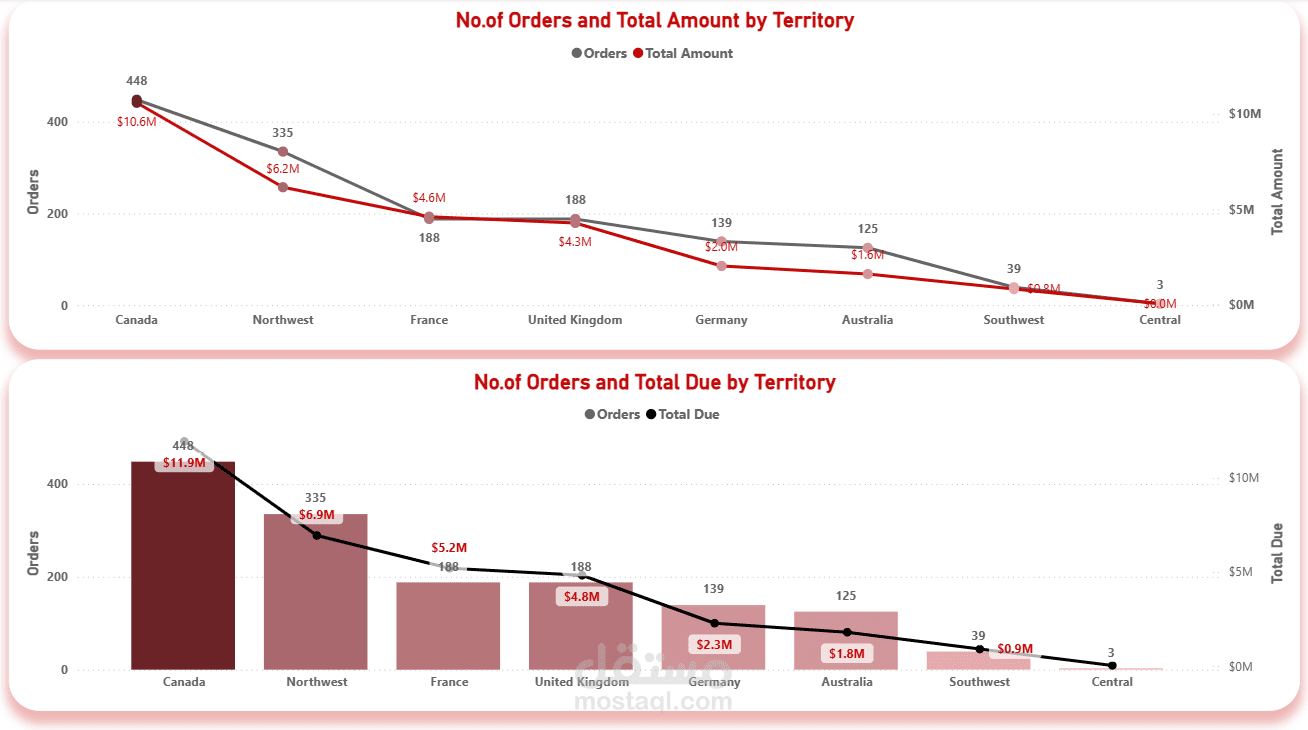
-Canada is leading with over $10.6M in total amount and the highest number of orders.
-Meanwhile, the Central region seems to be on vacation with only 3 orders .
-Bikes category took the spotlight, outperforming all other categories.
-Most orders were either Approved or Shipped, showing an efficient fulfillment process .
Tools:
PowerBI.