Dashboard Power BI
تفاصيل العمل
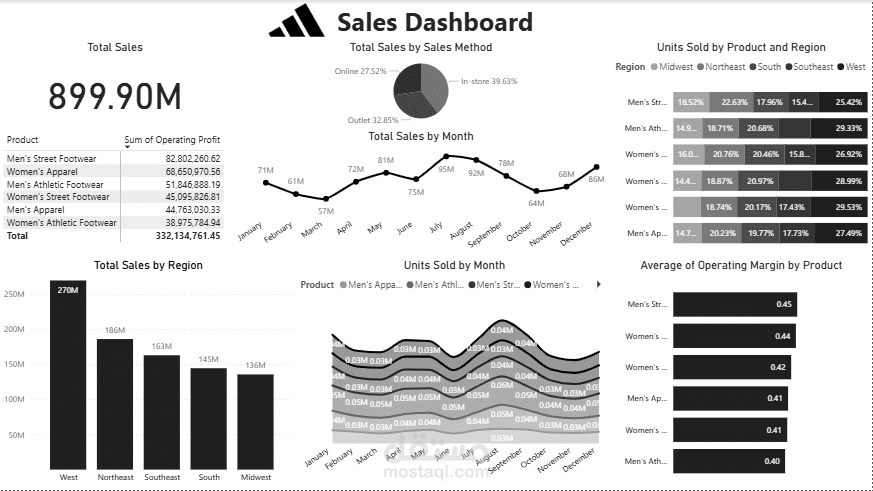
I designed this dashboard using Power BI to analyze Adidas sales data, aiming to present the most important financial and business KPIs in a clear and insightful way.
The analysis includes:
- Total Revenue: $899.9M
- Net Profit: $332.13M
- Units Sold: 2.47M
Through this dashboard, I visualized:
- Sales distribution by Sales Method (In-store, Outlet, Online)
- Product performance by Operating Profit and Margin
- Regional sales comparison
- Monthly and yearly sales trends