Dashboard sales for Misuo
تفاصيل العمل

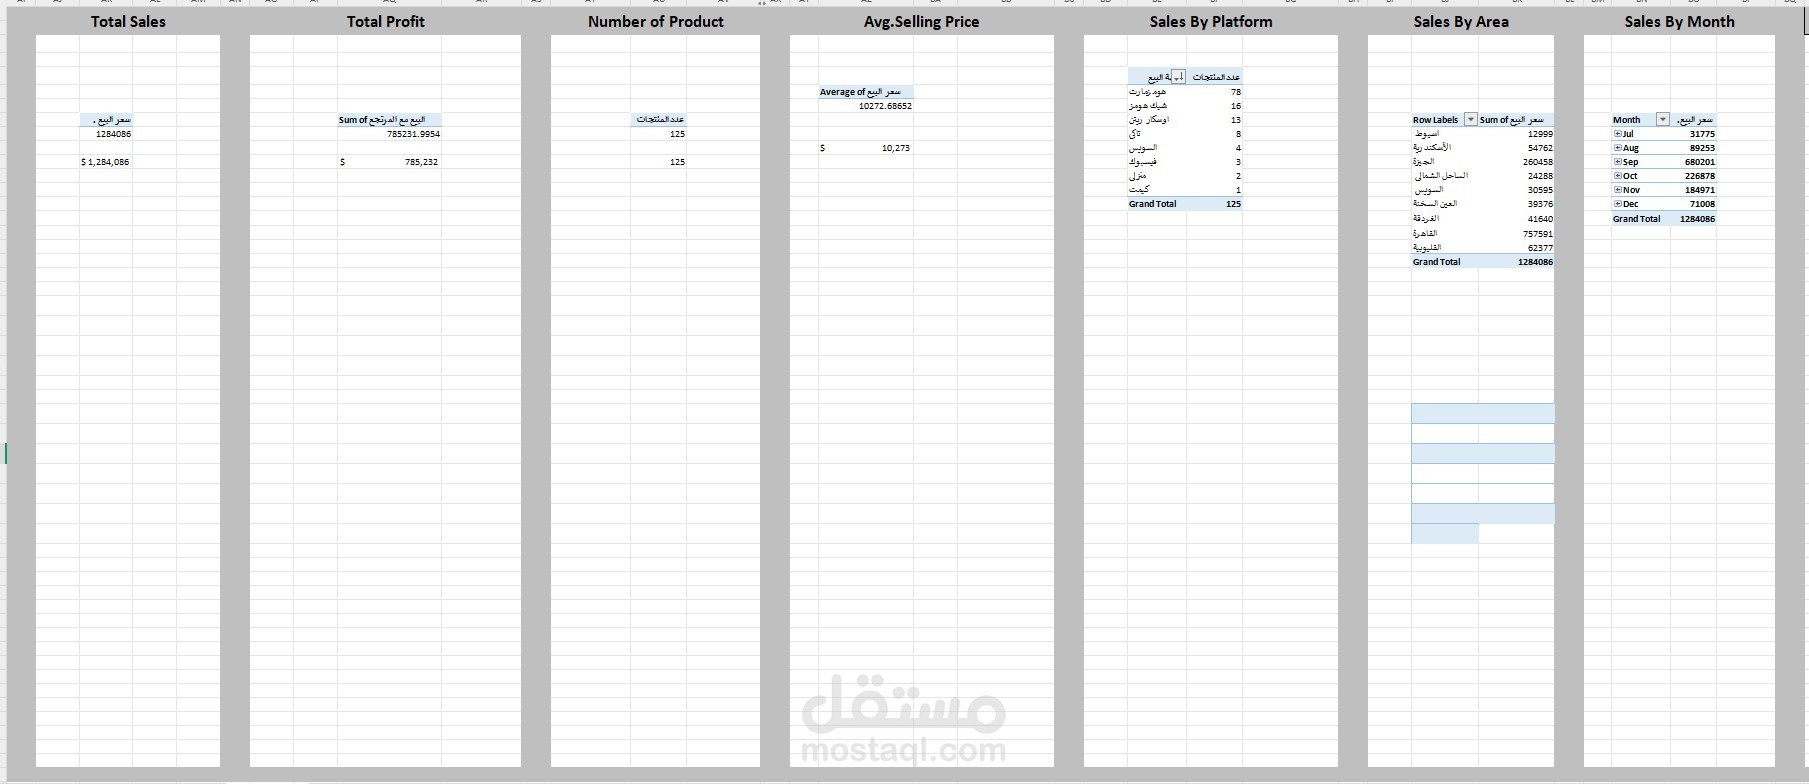
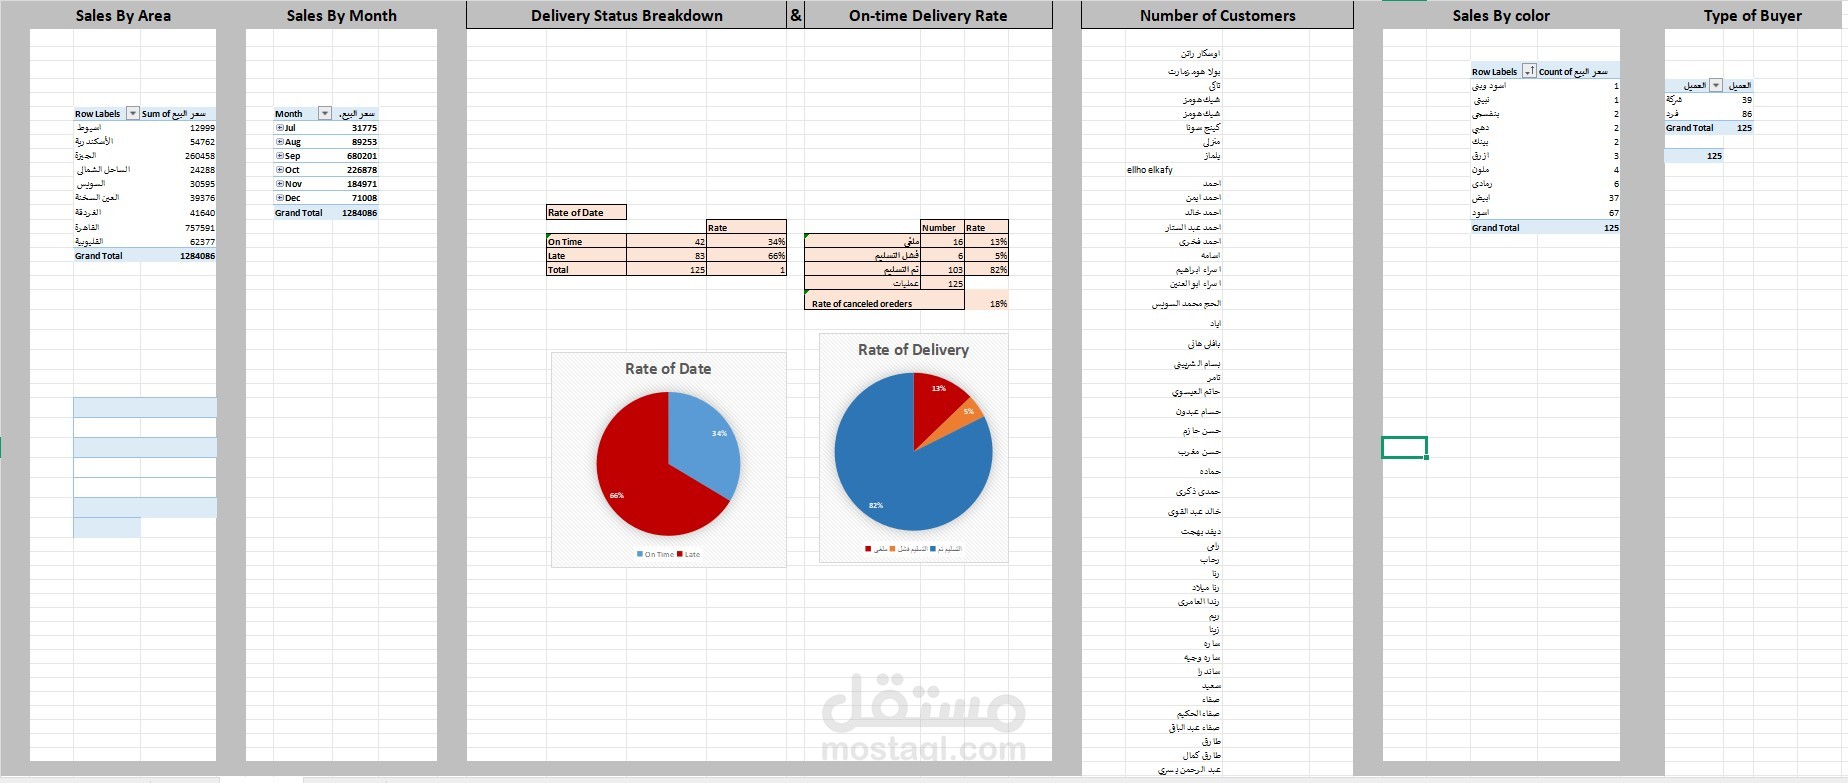
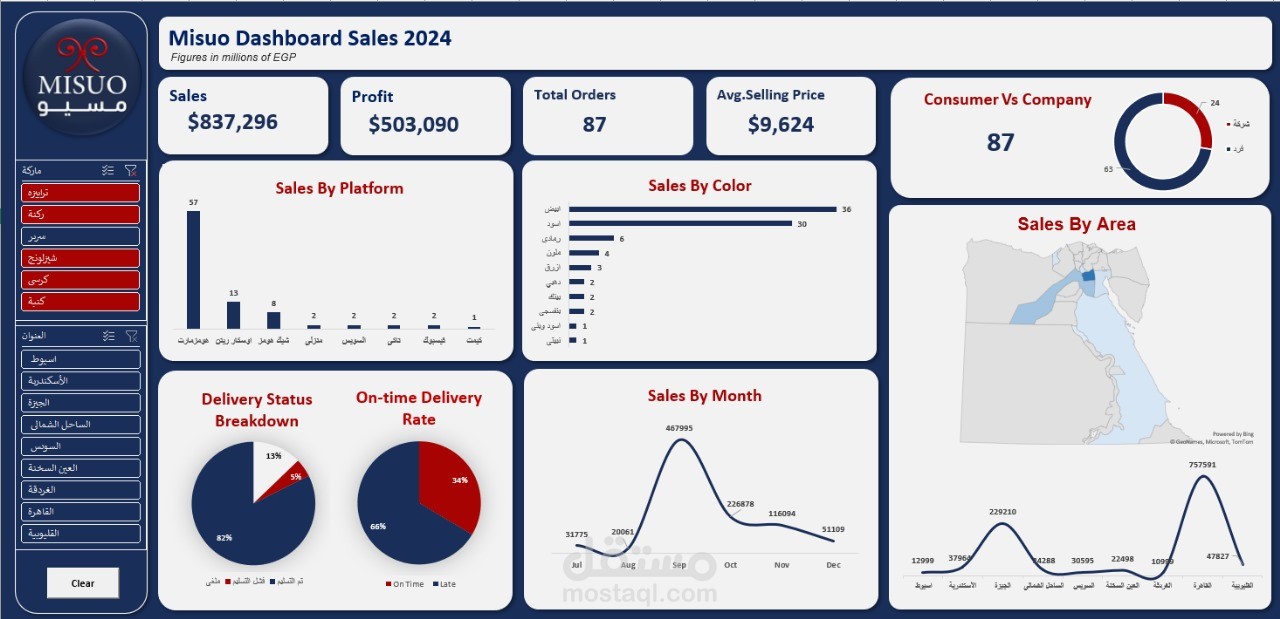
I worked with a real dataset from Masuo Furniture Company — it was messy at first, but I transformed it into something clear, interactive, and decision-friendly. Most of the effort (around 70%) went into data cleaning with (Power Query - Excel) — standardizing region names, fixing missing values, and grouping products into consistent categories.The final dashboard highlights:
Overall sales & order performance
On-time delivery rates
Top-selling products
Regional sales comparisons
Payment methods & customer types