Data analysis
تفاصيل العمل
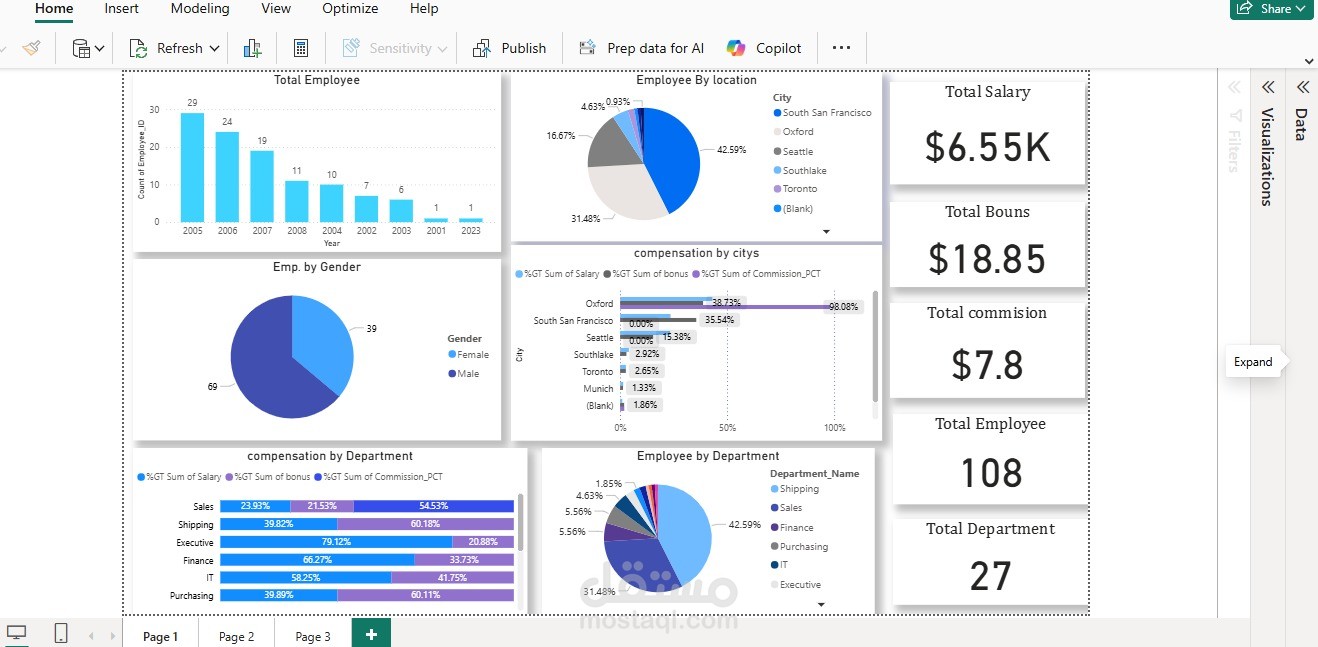
his dashboard provides a detailed overview of employee data, focusing on demographics, location, and compensation.
Key Metrics
The right-hand side of the dashboard displays top-level Key Performance Indicators (KPIs):
Total Salary: $6.55K
Total Bonus: $18.85
Total Commission: $7.8
Total Employee: 108
Total Department: 27
Employee Demographics & Distribution
Total Employee by Year: The bar chart at the top left shows the number of employees hired each year. The highest hiring years were 2005 (29 employees) and 2006 (24 employees).
Employee by Gender: A donut chart shows the gender breakdown, with 69 male employees and 39 female employees.
Employee by Location: A pie chart breaks down employees by city. The largest portions are in South San Francisco (42.59%) and Oxford (31.48%).
Employee by Department: Another pie chart shows the distribution of employees across departments. The top three are Shipping (42.59%), Sales (31.43%), and Finance (5.56%).
Compensation Analysis
Compensation by City: A bar chart compares compensation components (salary, bonus, and commission) by city. Oxford has the highest percentage of total compensation, with a high portion coming from the sum of bonus.
Compensation by Department: A similar bar chart breaks down compensation by department. Sales and Executive departments show a high percentage of commission, while Finance and IT have a higher percentage of salary.