Realstate Market analysis& Web Scrap
تفاصيل العمل
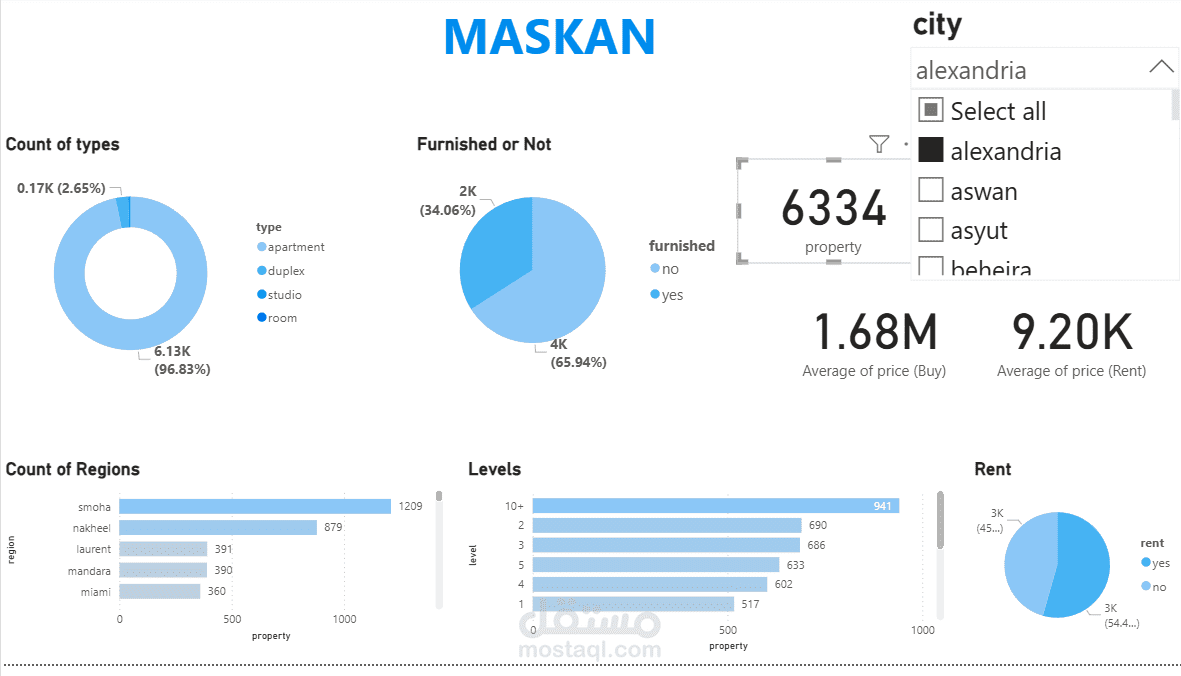
Data Scraping with Python involved collecting real estate data from websites using BeautifulSoup, Requests, and Pandas
for cleaning and exporting to CSV. Data Analysis in Power BI included importing the data, applying transformations, and
creating visualizations like price trends, geographical insights, and property type distributions. Key Insights included price
movements, regional demand, property type trends, and market growth.