PHONE SEARCH
تفاصيل العمل
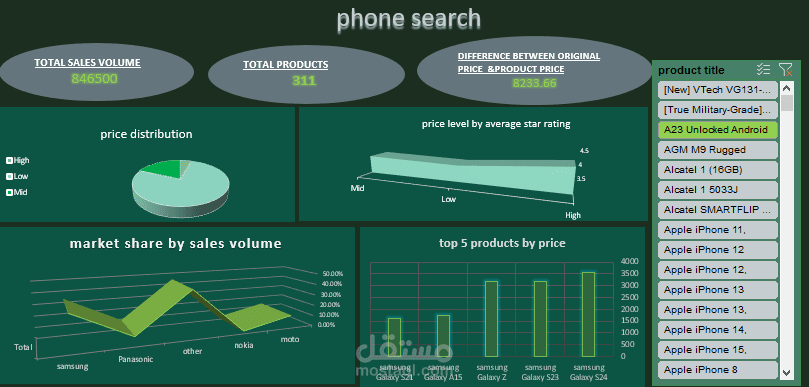
Key Highlights:
- Total Sales Volume: 846,500 units
- Product Count: 311 models
- Avg. Price Gap: 233.65 (between original and selling price)
What the visuals reveal:
- Price distribution across market tiers
- How customer ratings vary by price level
- Brand dominance in sales volume
- Top 5 premium-priced products
- Scrollable product list for quick reference
️ Built using Excel with Power Query, custom visuals, and tailored UI elements to ensure clarity and impact.