Sustainability Rating
تفاصيل العمل
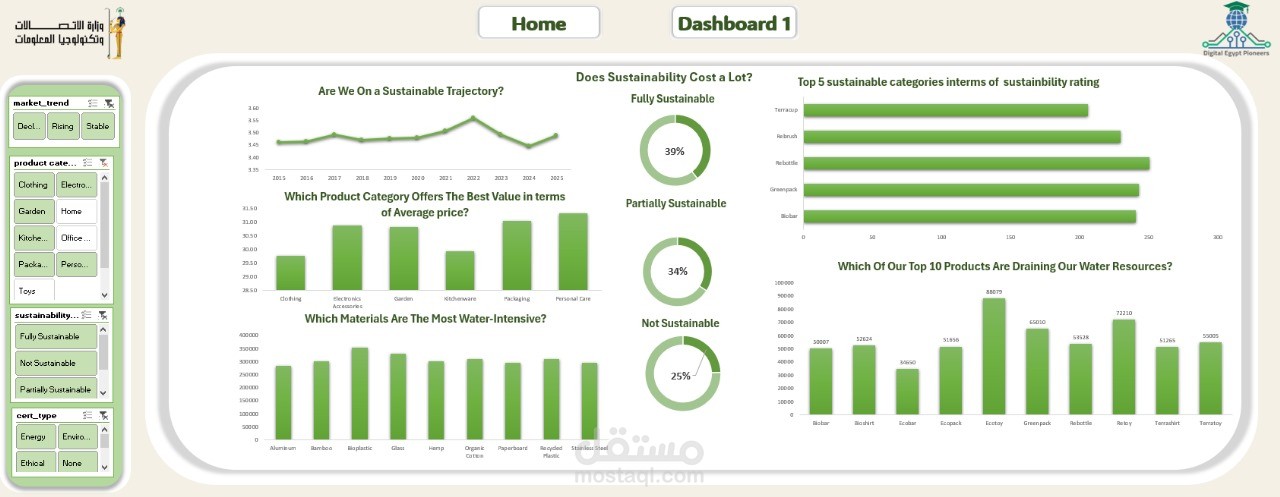
Excel Dashboard Project – Sustainability
Introduction
In this project, I created an interactive sustainability dashboard using Microsoft Excel for analyzing environmental performance across different brands, countries, and years. The goal was to organize raw sustainability data into a clear and structured format to enable analysis of key sustainability indicators and trends.
Key Features:
KPIs: Sustainability Rating, Carbon Footprint, Water Usage, Waste Production.
Data Organization: Transforming raw data into a structured fact table linked with dimension tables (Brand, Country, Year, Certification, Market Trend, Material, Product Category).
Trend Analysis: Yearly and regional comparison of sustainability performance.
Category Insights: Performance of different product categories in sustainability.
Interactive Filters: Using slicers and pivot tables to filter data by brand, country, year, and KPI.
Outcome:
The dashboard provides a clear and interactive way to monitor sustainability metrics, helping stakeholders identify areas for improvement, measure environmental impact, and make informed decisions.
This project showcases skills in data processing, SQL integration, Excel dashboard creation, and environmental data analysis.