universal vehicles co
تفاصيل العمل
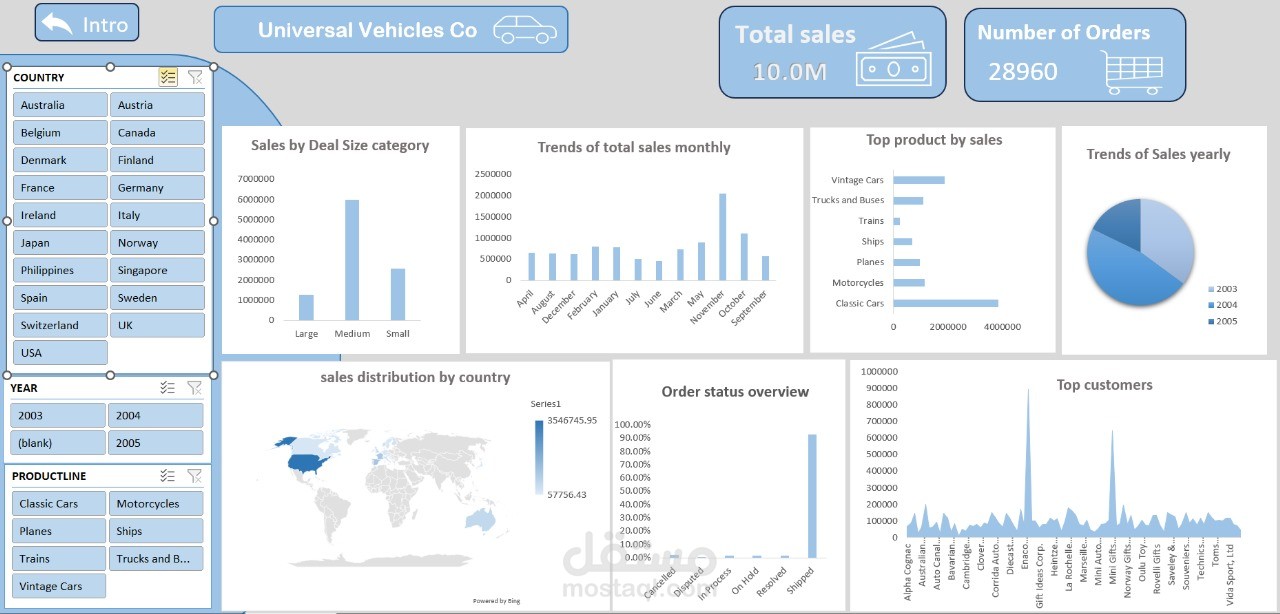
Excel Sales Dashboard Project
I developed an interactive Excel dashboard for Universal Vehicles Co to analyze sales performance between 2003 and 2005.
The dashboard presents a clear overview of company performance, with total sales of 10M and 28,960 orders.
Key Highlights:
Data Visualization: Charts showing sales trends monthly and yearly, top-selling products, and customer performance.
KPIs: Tracking total sales, number of orders, and order status distribution.
Filters (Slicers): Users can filter results by country, year, and product line.
Geographical Analysis: Sales distribution displayed across different countries using a map.
Customer Insights: Identification of top customers and main contributors to revenue.
Outcome:
This dashboard provides managers with actionable insights to monitor sales growth, identify best-selling products, evaluate customer impact, and compare market performance across regions. It demonstrates my ability to apply data analysis, visualization, and Excel dashboard design to generate valuable business insights.