Excel dashboards for Chillix store
تفاصيل العمل
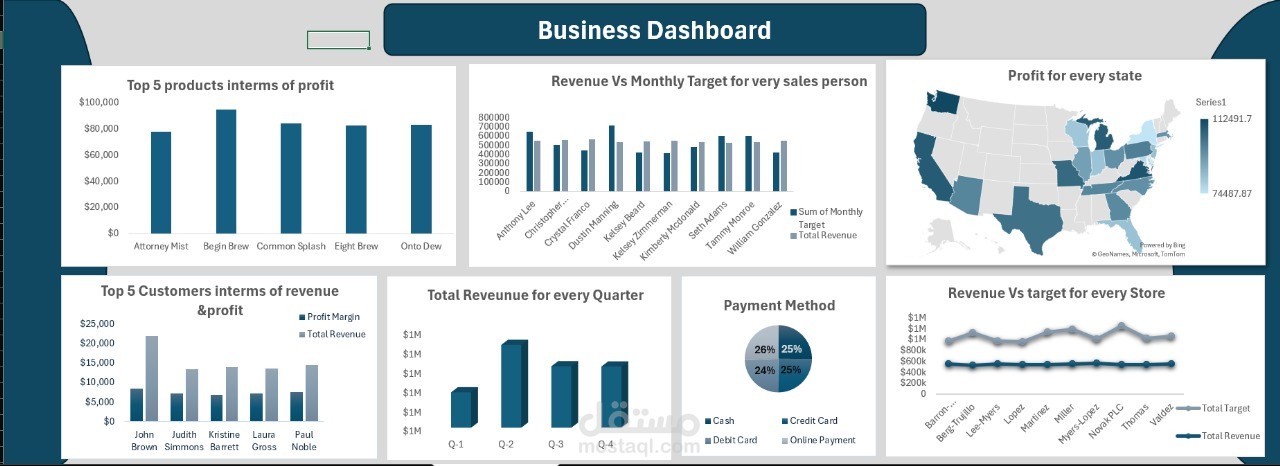
Excel Dashboard Project – Chillix Store
Introduction
In this project, I created an interactive sales dashboard using Microsoft Excel for Chillix Store.
The goal was to provide a clear view of sales and profit performance, identify top products, and analyze customer and regional trends.
Key Features:
KPIs: Total sales, total profit, and number of orders.
Sales & Profit Trends: Monthly analysis to track growth over time.
Product Insights: Best-selling products and categories performance.
Customer & Regional Analysis: Sales distribution across regions and customer segments.
Filters (Slicers): Allowing users to filter data by category, sub-category, region, and year.
Outcome:
The dashboard helped highlight profitable products, top-performing regions, and monthly sales patterns, supporting better decision-making.
This project demonstrates my skills in data analysis, visualization, and Excel dashboard design to deliver meaningful business insights.