Market Analysis Dashboard – Sales and Customer Insights Using Power BI
تفاصيل العمل
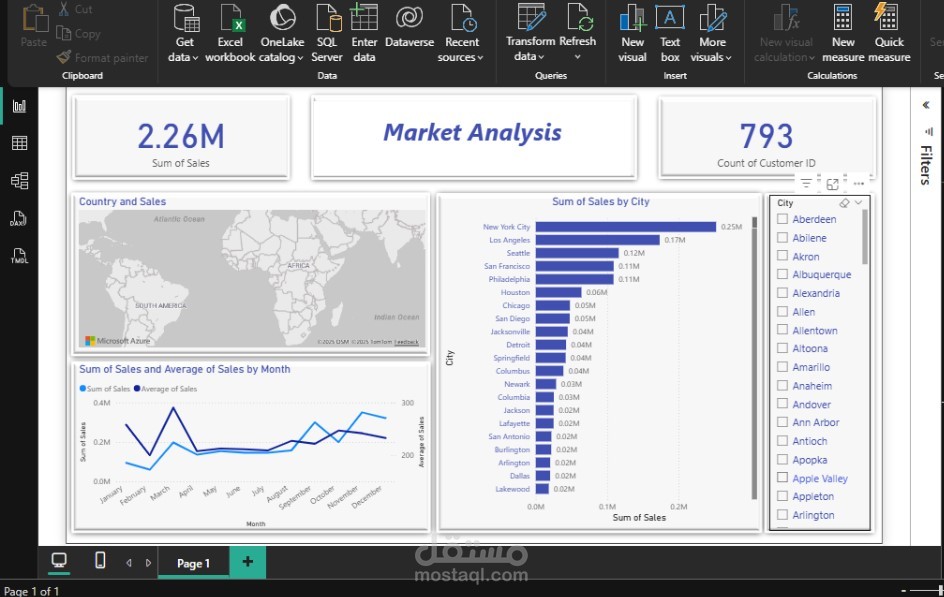

This project presents an interactive Market Analysis Dashboard built using Microsoft Power BI, aimed at providing valuable insights into sales performance and customer distribution across different cities and time periods.
The dashboard enables users to monitor total sales, track monthly performance trends, and visualize geographical distribution of sales through interactive charts and maps. It allows for quick data-driven decision-making and business strategy optimization.