London Houses Dashboard – Real Estate Data Analysis Using Power BI
تفاصيل العمل
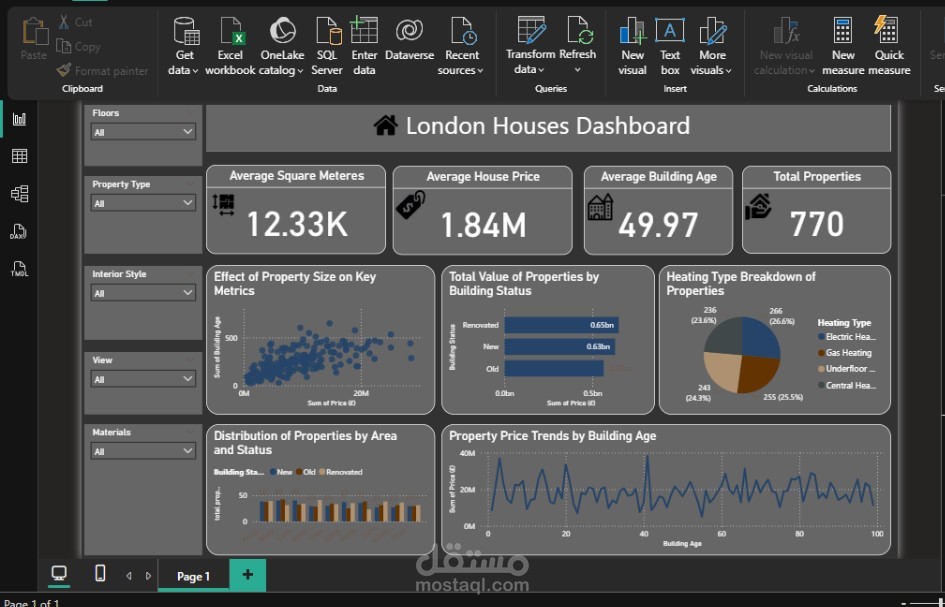

This project presents a comprehensive data analytics dashboard built using Microsoft Power BI, designed to analyze and visualize housing data in London. The goal is to help users gain valuable insights into property prices, building conditions, and housing characteristics across different areas of the city.
The dataset includes details such as house prices, property types, building age, area in square meters, heating types, and renovation status.
The dashboard is fully interactive, allowing users to filter and explore data dynamically using multiple slicers (e.g., Floors, Property Type, Interior Style, View, and Materials).