Coffee Shop Sales Analysis
تفاصيل العمل
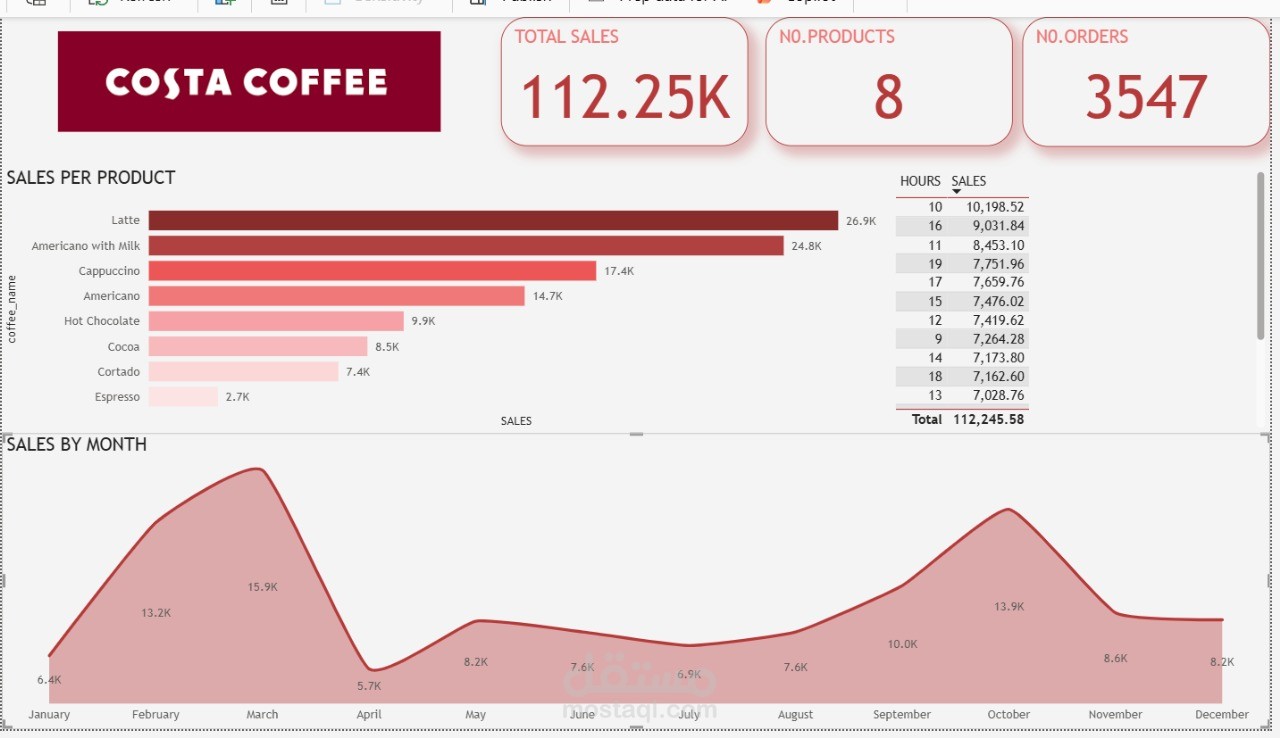

I’ve built this interactive Power BI dashboard to analyze sales performance for a coffee shop.
The dashboard includes:
• Total Sales, Products, and Orders KPIs
• Top 10 hours generating the highest revenue
• Product sales ranking visualization
• A dynamic line chart that switches between daily, monthly, quarterly, and yearly views
The purpose of this project was to practice data visualization, storytelling, and dashboard design using Power BI.