Power BI Dashboards & Visualizations Project
تفاصيل العمل
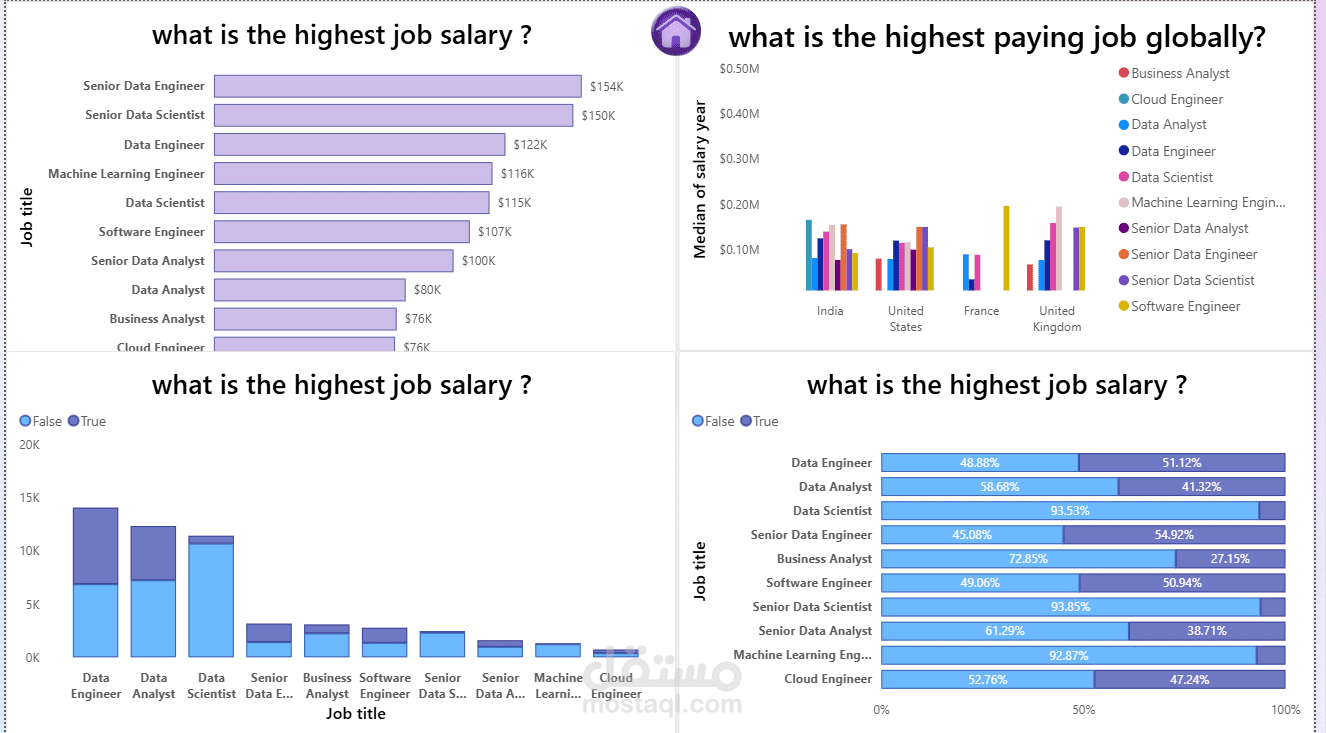
This project showcases a collection of interactive dashboards and data visualizations built using Power BI during a comprehensive training course.
Key Features:
Bar, Line, and Scatter Charts
Dynamic Slicers and Filters
Interactive Bookmarks and Navigation Buttons
KPI Cards for Performance Tracking
Each dashboard demonstrates the ability to analyze data, uncover insights, and present findings in a visually compelling way, aligning with real business needs.