Steam Games Market Intelligence Dashboard | Power BI Data Analysis
تفاصيل العمل
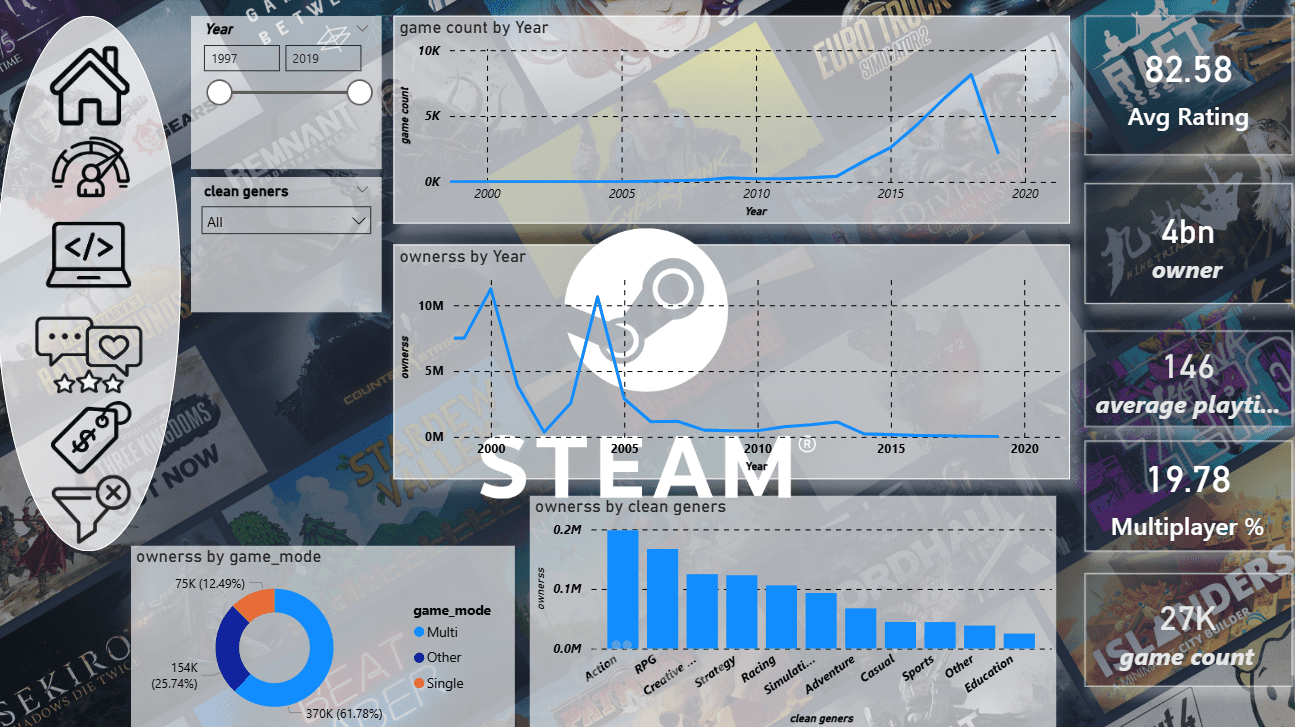
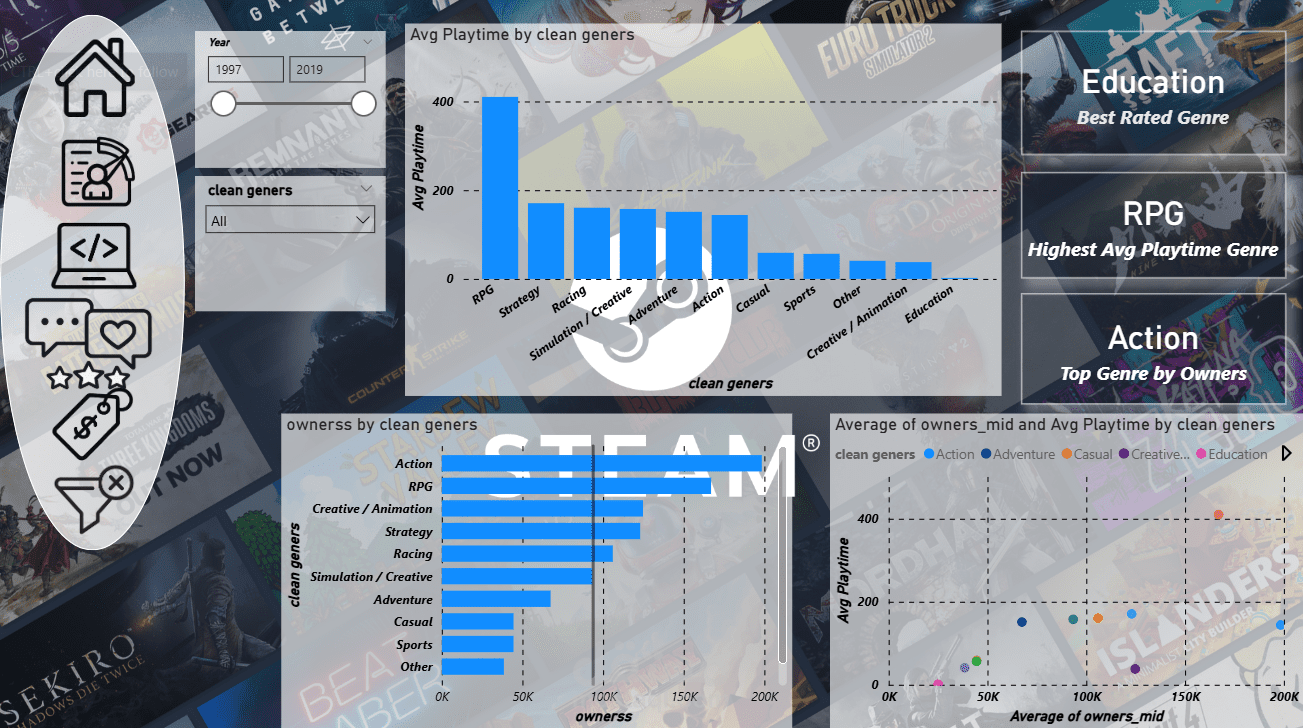
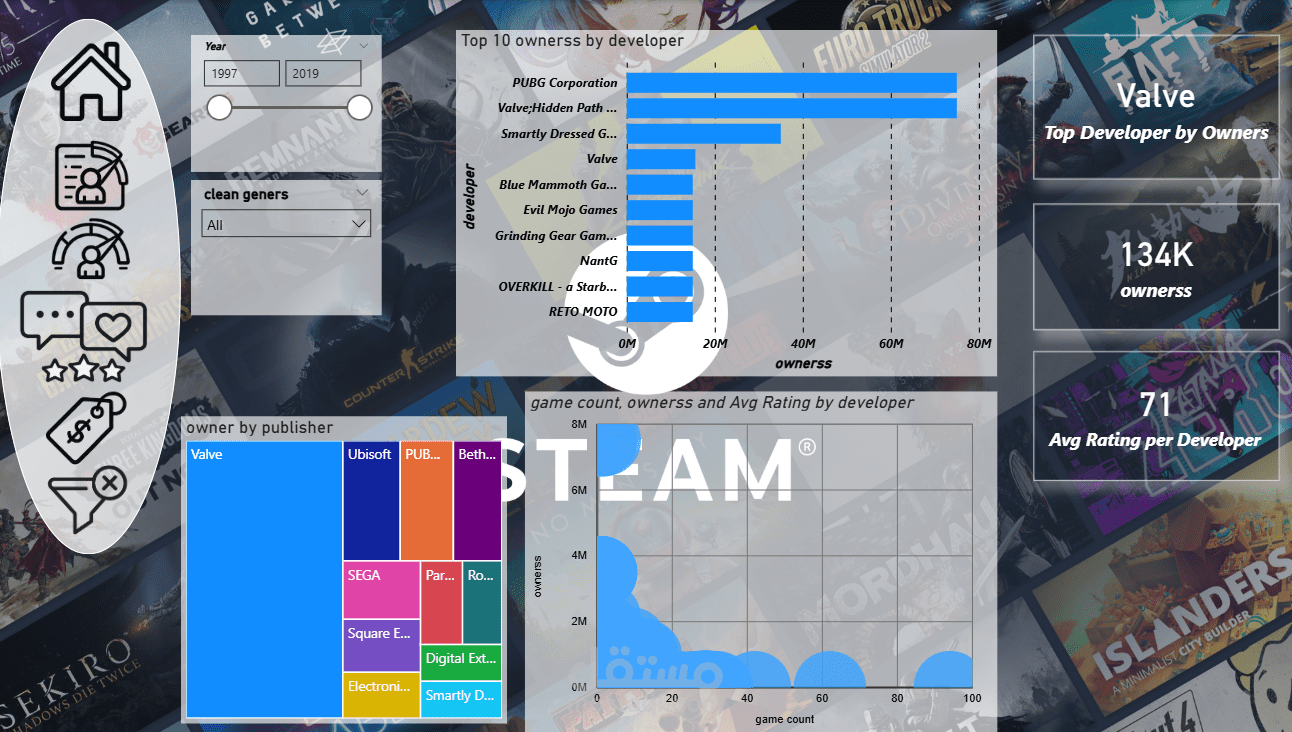
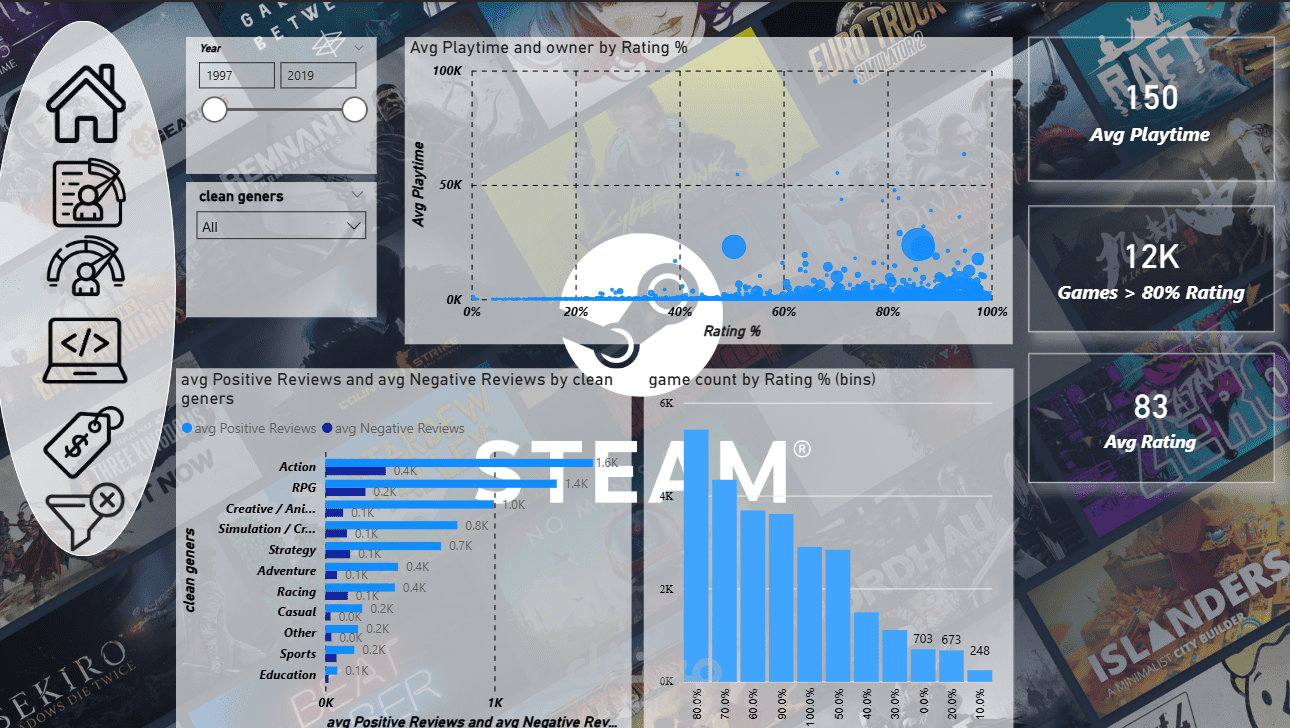
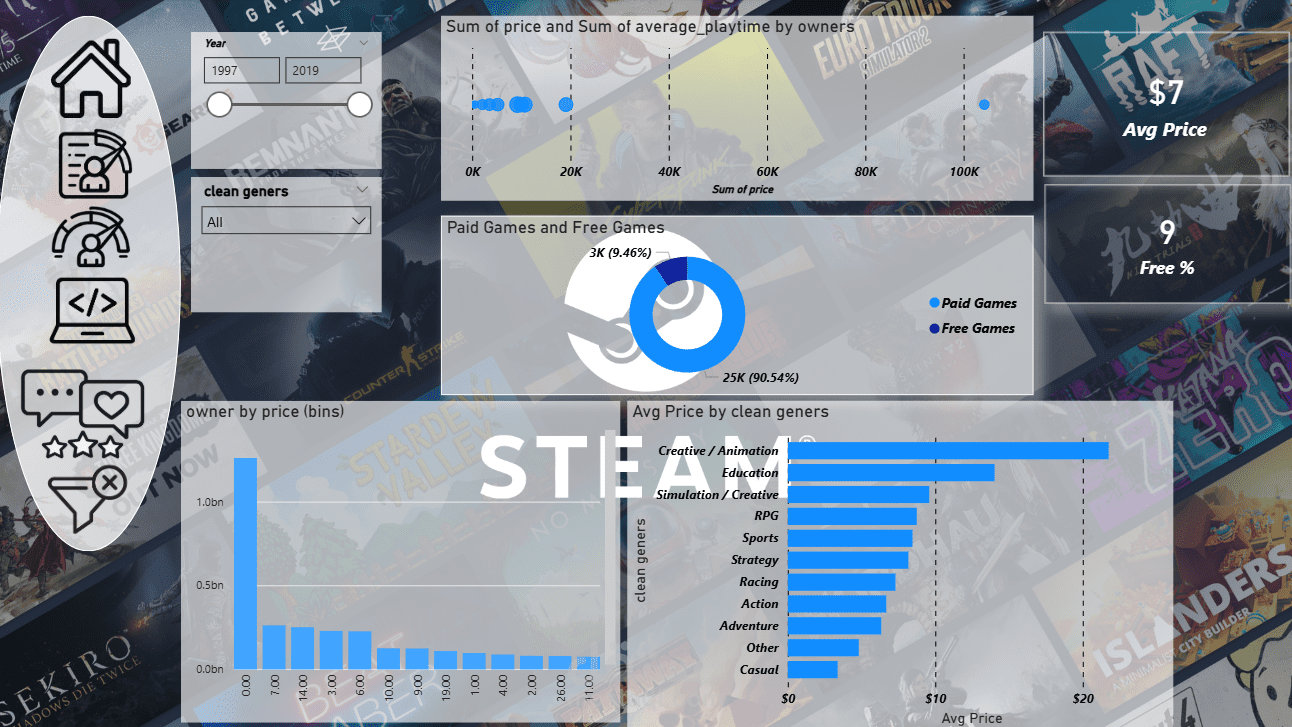
steam Games Market Intelligence Dashboard
Interactive Power BI dashboard analyzing the Steam games market (1997–2019) to uncover trends in genres, developers, pricing, and player engagement, enabling data-driven business decisions.
Business Problem
Game publishers and developers often lack a clear understanding of which genres, pricing strategies, and developers drive the highest player engagement and ownership, making strategic business decisions difficult.
Objective
Develop an interactive Power BI dashboard to analyze Steam games, identify market trends, evaluate developer performance, and discover pricing and engagement patterns.
Dataset
Source: Public Steam Games Dataset
Size: 5,500+ Games
Features:
Genre
Developer
Publisher
Owners
Price
Playtime
Ratings & Reviews
Release Year
Tools & Technologies
Power BI
Power Query
DAX
Data Modeling
Project Workflow
Data Cleaning & Transformation
Data Modeling
KPI Development
Exploratory Data Analysis (EDA)
Interactive Dashboard Design
Business Insights & Recommendations
Pricing Dashboard
Key Insights
Action games generated the highest ownership.
RPG games achieved the highest average playtime.
Multiplayer games attracted significantly more players.
Games priced between $0–$10 performed best.
Education games received the highest average ratings.
Business Recommendations
Invest in Action and RPG genres.
Incorporate multiplayer features to increase engagement.
Keep pricing competitive within the $0–$10 range.
Explore niche genres to reduce market competition.
Business Impact
This dashboard helps publishers and developers make data-driven decisions regarding pricing, genre selection, marketing strategies, and product planning through interactive analytic