Call center
تفاصيل العمل
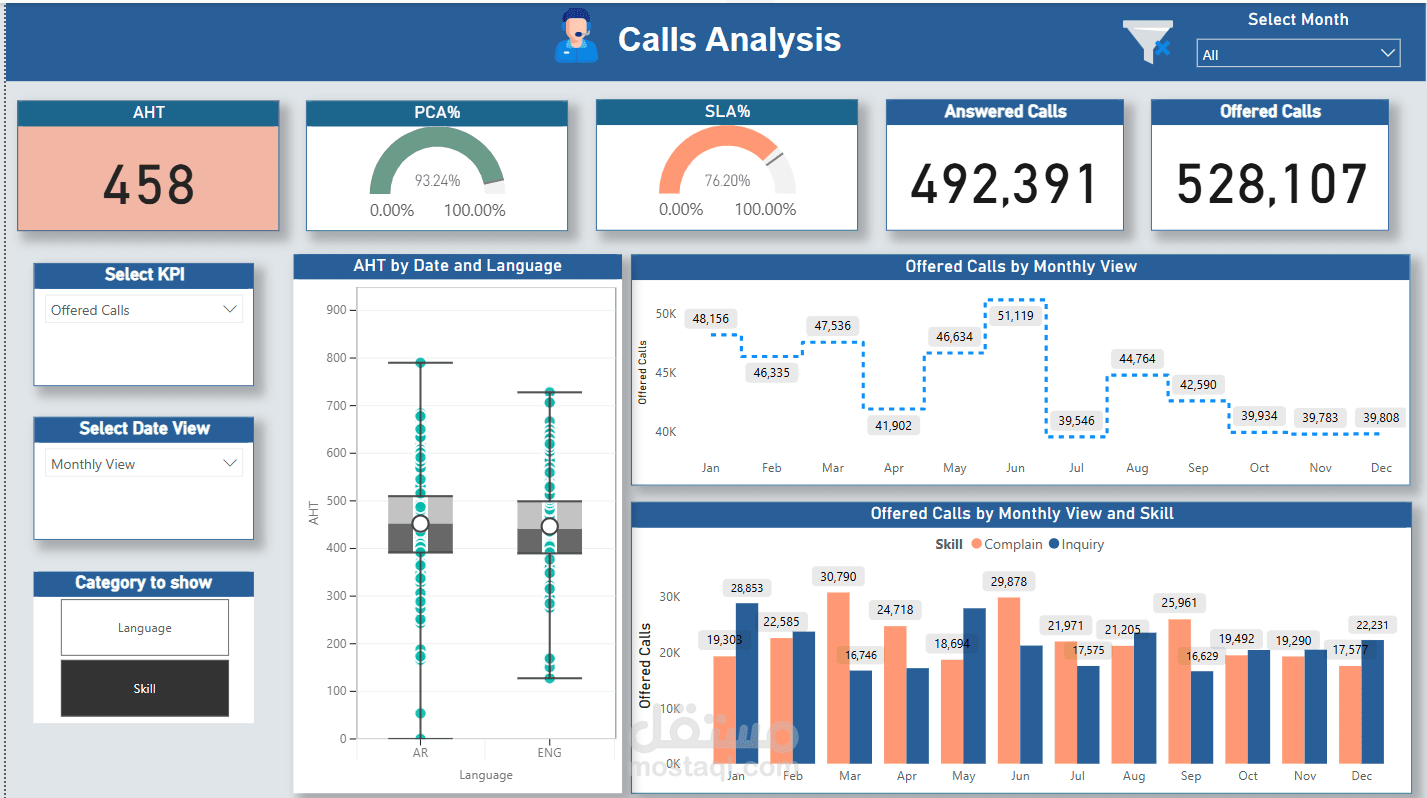
Interactive Charts
Average Offered Calls Per Day: Trend analysis of offered calls on a daily basis.
Offered Calls by Day of the Week: Visualization of average offered calls across each day.
Total Offered Calls Per Skill (Monthly View): Monthly breakdown by skill.
AHT Per Language (Quarterly): Performance comparison across different languages for each quarter.
Percentage of Answered Calls per Skill: Insight into performance metrics by skill.
AHT Comparison for AR & ENG Teams: A boxplot chart comparing AHT between AR and ENG teams with descriptive insights.
CSAT & FCR Relationship: Chart showing the relationship between customer satisfaction and first call resolution scores.