Call Center Insights Dashboard
تفاصيل العمل
This dashboard is designed to provide an interactive and comprehensive view of call center performance, enabling users to monitor key performance indicators (KPIs) and gain valuable insights into operations.
Overview
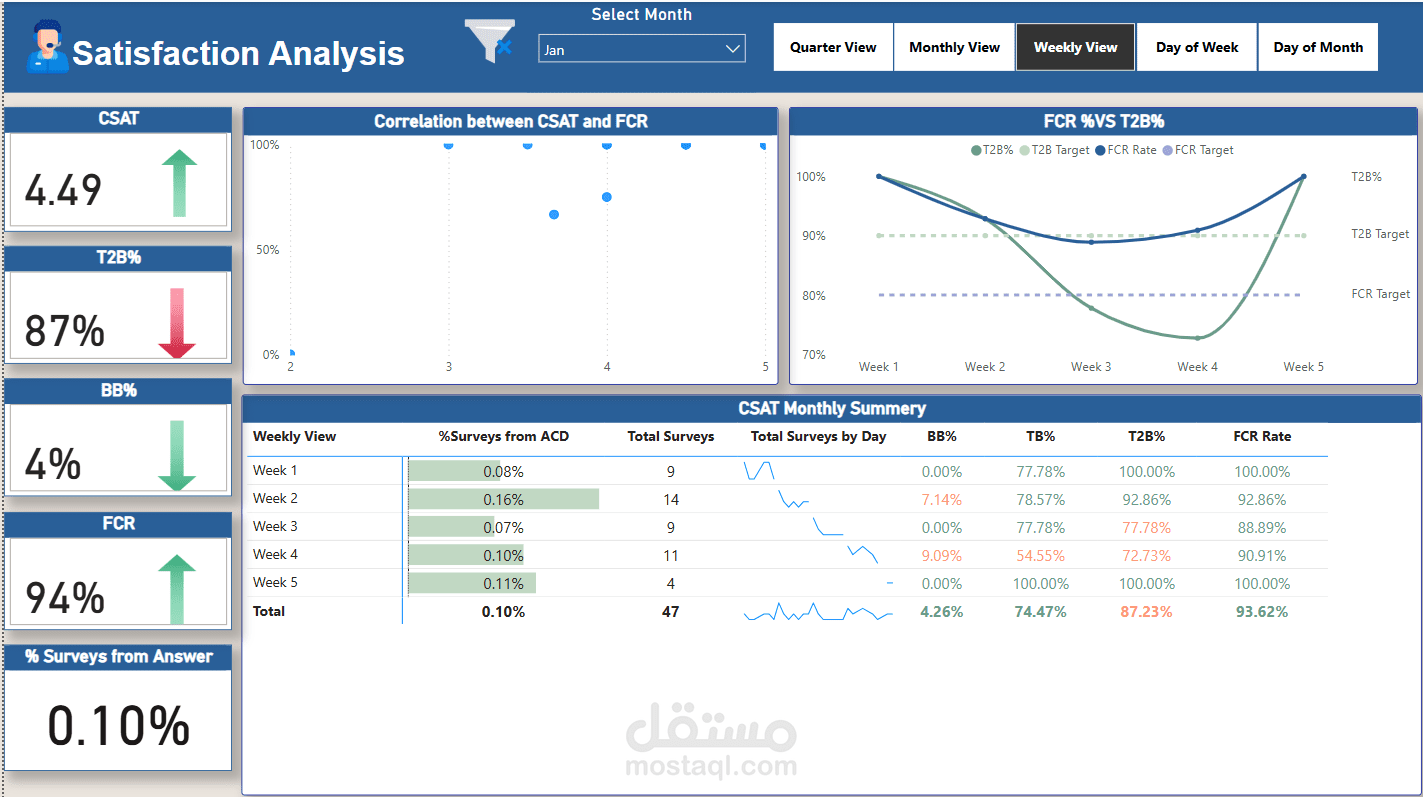
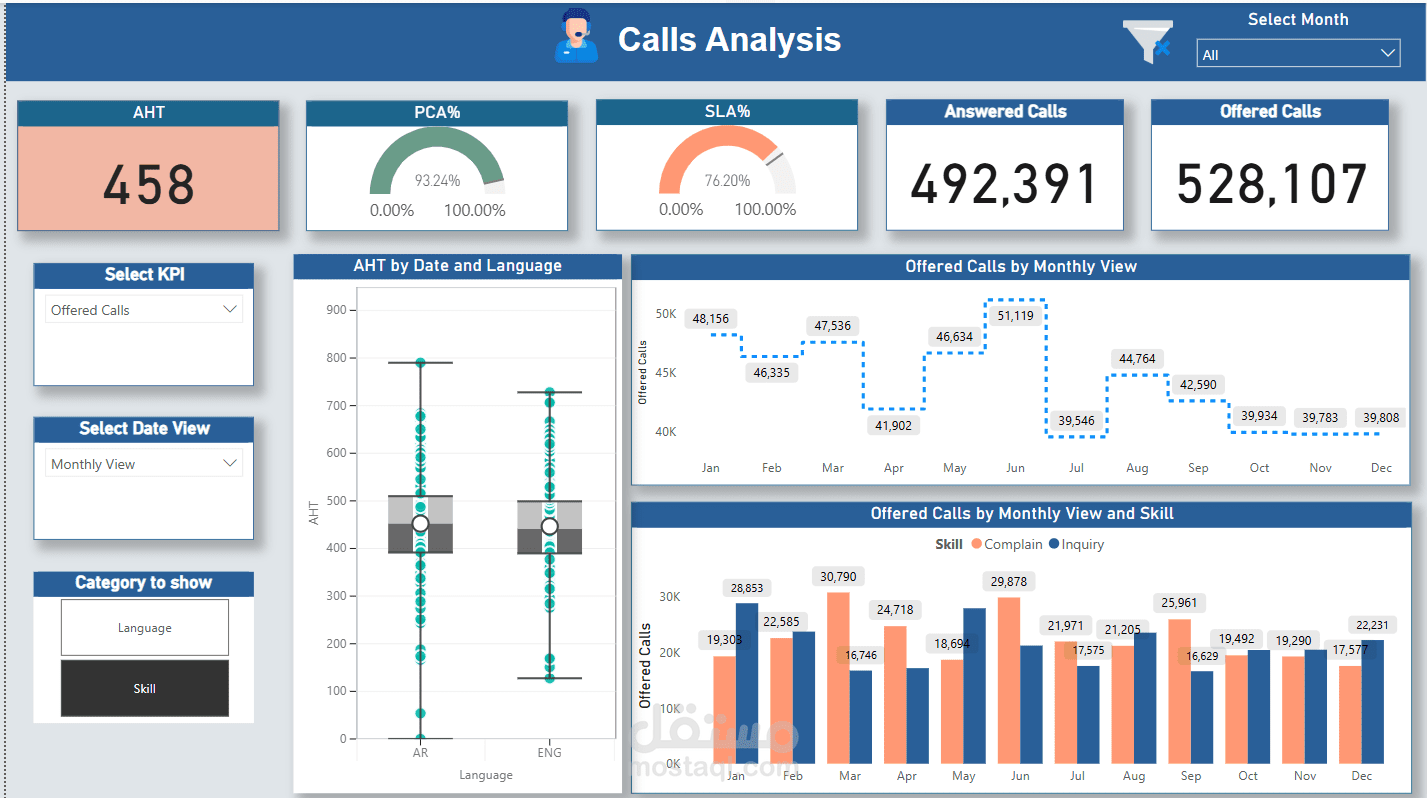
The dashboard integrates multiple data sources and provides visualizations for critical metrics including Average Handle Time (AHT), Percentage of Answered Calls (PCA%), Service Level Agreement (SLA%), Customer Satisfaction (CSAT), and First Call Resolution (FCR). With interactive charts, bookmarks, slicers, drill-throughs, and tooltips, users can explore detailed views and trends in call center data.
Features
Key Metrics Calculation & Visualization
Average Handle Time (AHT): Computed as Total Handle Time divided by Answered Calls.
Percentage of Answered Calls (PCA%): (Answered Calls / Offered Calls) * 100.
Service Level Agreement (SLA%): (Answered Calls Within Service Level / Offered Calls).
Interactive Charts
Average Offered Calls Per Day: Trend analysis of offered calls on a daily basis.
Offered Calls by Day of the Week: Visualization of average offered calls across each day.
Total Offered Calls Per Skill (Monthly View): Monthly breakdown by skill.
AHT Per Language (Quarterly): Performance comparison across different languages for each quarter.
Percentage of Answered Calls per Skill: Insight into performance metrics by skill.
AHT Comparison for AR & ENG Teams: A boxplot chart comparing AHT between AR and ENG teams with descriptive insights.
CSAT & FCR Relationship: Chart showing the relationship between customer satisfaction and first call resolution scores.