Sports Accessories Sales Dashboard with Power BI
تفاصيل العمل
Project Overview:
This project highlights my skills in data visualization and sales analytics by building a comprehensive Power BI dashboard for a sports accessories sales company. The dashboard provides deep insights into sales performance, customer behavior, and key metrics, helping the business make informed decisions to drive growth.
️ Tools Used:
Power BI for data modeling, visualization, and dashboard design
Excel for initial data preparation and cleaning
DAX for creating calculated fields and measures
Sales Data extracted from the company’s database
? Project Creation Process:
Data Collection & Preparation:
I started by gathering sales data, including customer details, sales transactions, product categories, sales volumes, and geographical information. This data was then imported into Power BI for further analysis.
Data Cleaning:
I cleaned the data to remove any inconsistencies or missing values, ensuring that all fields, such as product categories, customer names, and sales figures, were properly formatted.
Data Modeling:
Using Power BI’s relationship features, I established connections between tables like sales transactions, products, and customers. I also created new calculated fields with DAX to calculate key metrics like total sales, average order value, and sales by product category.
Dashboard Design:
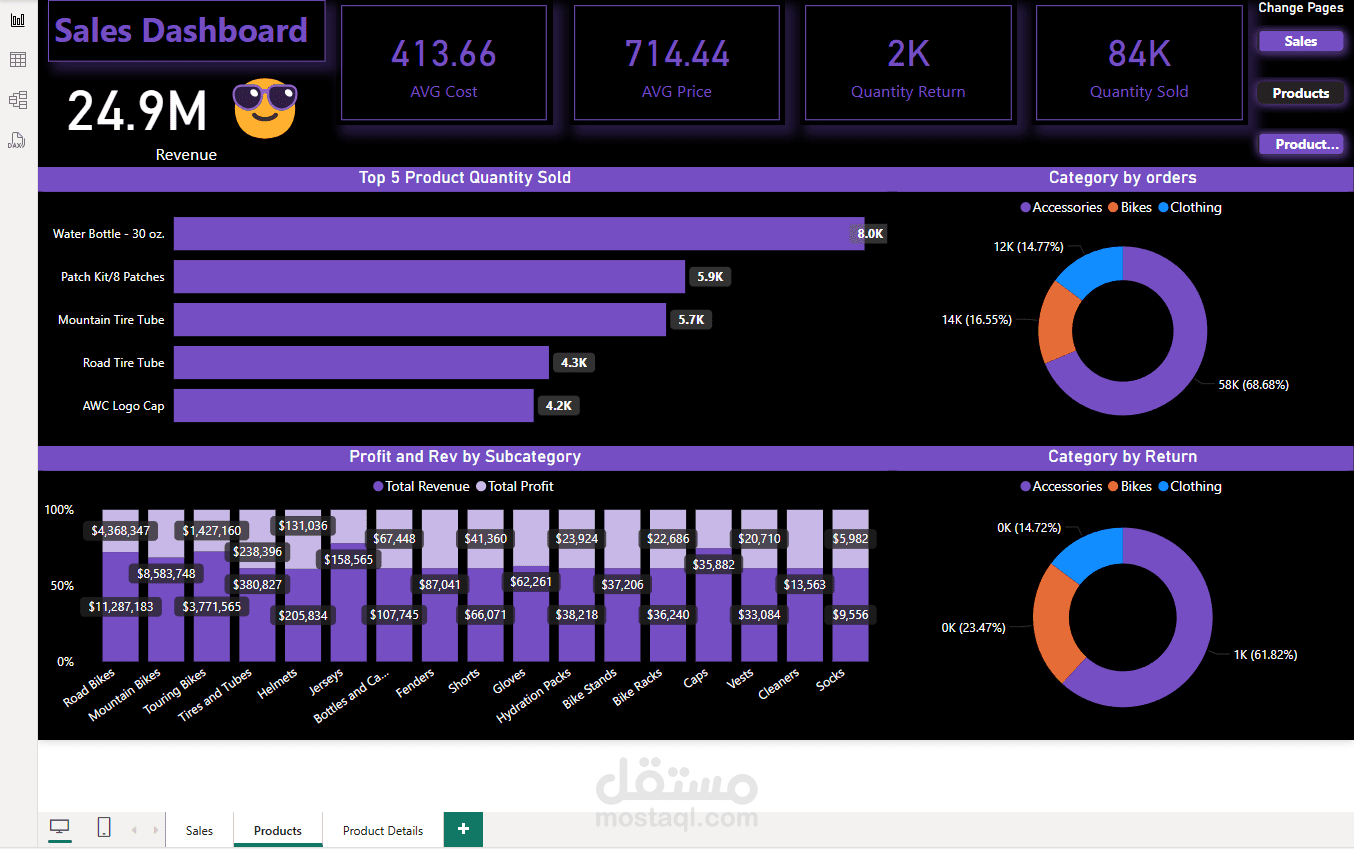
The dashboard consists of three pages:
Page 1: Overview & Sales Performance – Displays high-level metrics like total sales, total orders, and top-selling products, with interactive filters for time period, product categories, and customer demographics.
Page 2: Customer Insights – Shows a detailed analysis of customers, including purchase patterns, average spending, and geographical distribution.
Page 3: Product Analysis – Focuses on individual products, with insights on sales volume, revenue, and performance by category, along with a product comparison feature.
Key Features:
Three interactive dashboard pages: Overview & Sales Performance, Customer Insights, Product Analysis
Slicers for filtering by time period, product categories, customer demographics, and regions
Visualizations including bar charts, line graphs, pie charts, and geographic maps for a detailed view of sales trends
DAX calculations to create custom metrics like total sales, average order value, and sales by region
Objective:
The objective of this project was to create a comprehensive and easy-to-navigate Power BI dashboard that gives the sales team insights into their performance, helps track customer behavior, and highlights opportunities for growth in the sports accessories market