Airline Flights Analysis Dashboard with Power BI
تفاصيل العمل
Project Overview:
This project showcases my ability to work with large-scale time-sensitive data by building a professional Power BI dashboard for an airline company. The dashboard provides a detailed and interactive view of daily flight operations, including the number of flights, flight durations, and passenger counts — all designed to support strategic and operational decision-making.
️ Tools Used:
Power BI for data visualization and interactive dashboard creation
DAX for advanced calculations and time intelligence
Cross-report functionality for seamless report interaction across pages
Interactive Charts including bar charts, line charts, pie charts, and dynamic cards
? Project Creation Process:
Data Collection & Preparation:
I worked with flight data that included daily schedules, flight durations, passenger numbers, and departure/arrival times. The dataset was cleaned and structured using Power BI's Power Query Editor.
Data Modeling:
I created relationships between tables (flights, aircrafts, passengers, routes) and applied DAX measures to calculate total flights per day, average flight duration, and total passengers.
Dashboard Design:
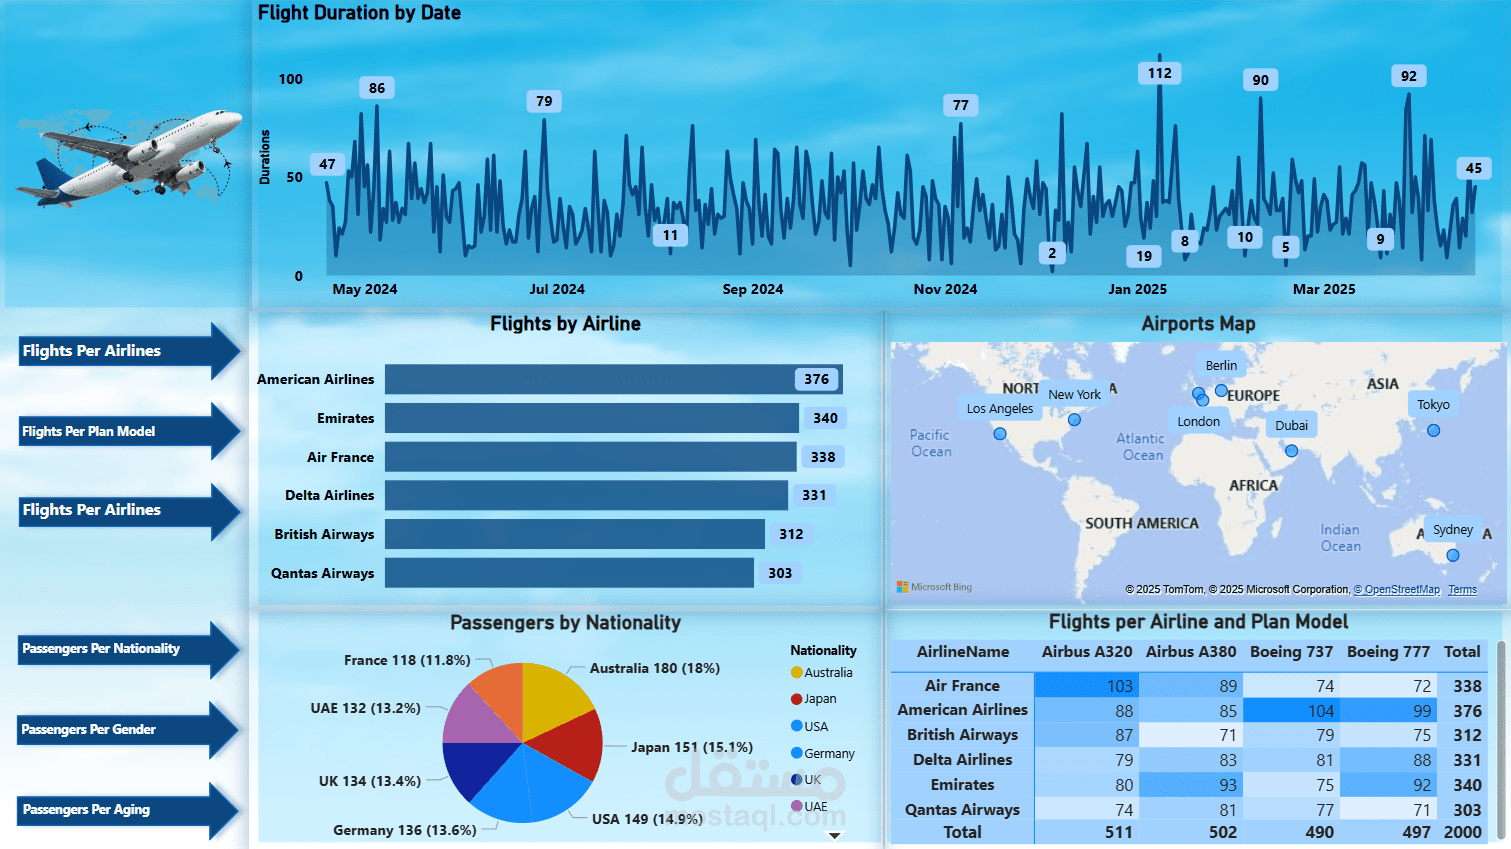
I designed a professional multi-section dashboard that includes:
Daily Flights Tracker – showing how many flights operate each day.
Flight Duration Analytics – analyzing average and total flight time.
Passenger Insights – total passengers per day and per route.
Interactive Charts – such as slicers for dates, destinations, and aircraft types.
Cross-report Features – enabled seamless navigation and filter sharing between multiple report pages.
Key Features:
Professional layout and clean visual design with real-time filters
Cross-report filtering for enhanced interactivity and storytelling
Multiple interactive visualizations, such as:
Line chart of flights per day
Pie chart for passenger distribution by destination
Bar chart comparing flight durations
Cards displaying key KPIs (Total Flights, Average Duration, Total Passengers)
Objective:
To help airline managers and analysts monitor daily operations, understand passenger loads, and optimize scheduling efficiency by providing a clear, data-driven view through a high-quality and interactive Power BI dashboard.