Order Analytics Dashboard
تفاصيل العمل
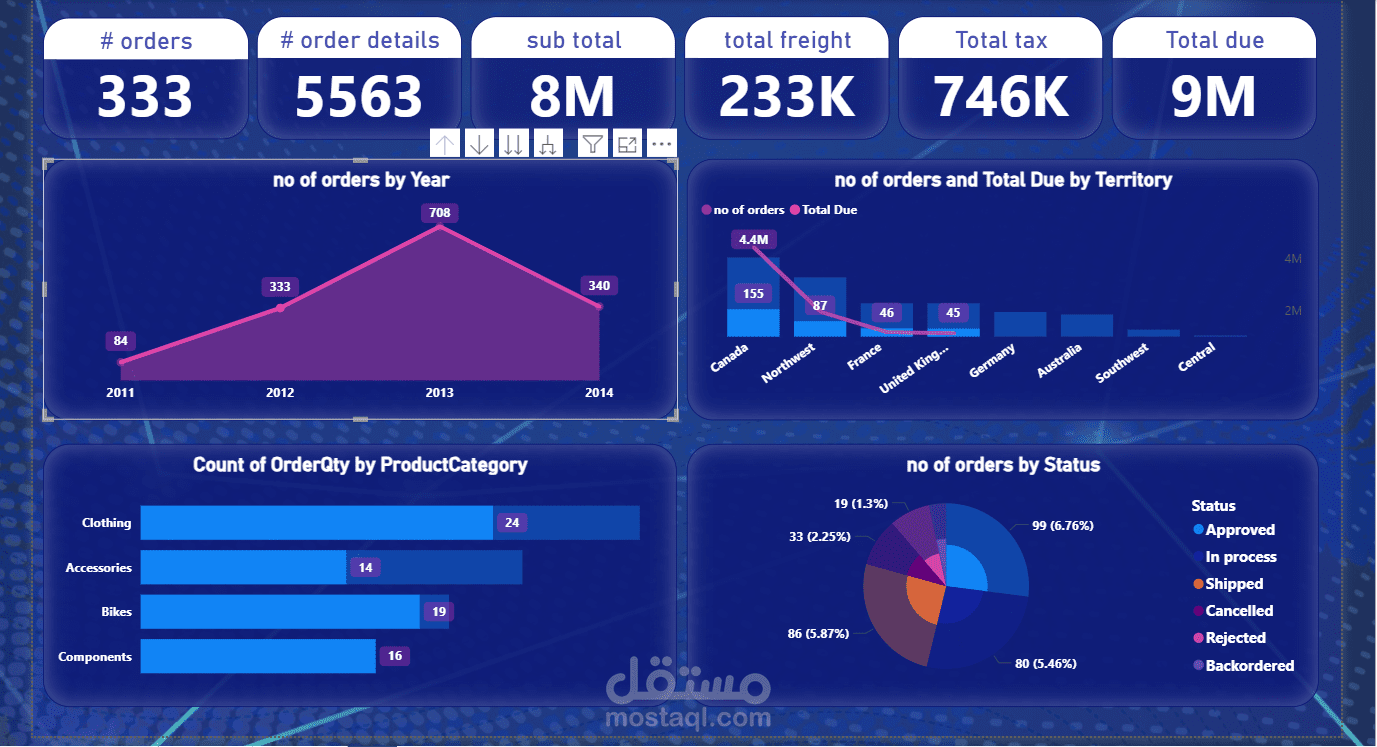
The "Order Analytics Dashboard" project, as depicted in the dashboard, is a comprehensive visualization of order-related data, utilizing Python for development and analysis. The report includes the following key insights:
Number of Orders: 121,000 orders.
Total Subtotal: 109.8 million.
Total Freight: 3.18 million.
Total Tax: 10.19 million.
Total Due: 123.2 million.
Max Order Quantity by Product: Displays a bar chart with varying order quantities across different products, peaking at 44 for the top product.
Count of Orders by Territory: A large blank section suggests detailed territorial data (e.g., Australia, Canada, Germany) is analyzed, though specific counts are not fully visible.
Orders by Ship Date and Due Date: A table shows monthly breakdowns, with a total of 31,465 orders by ship date and due date across 2013-2014, including peaks like 211 orders in April 2014.
Territory Sales and Total Due: A table lists sales and due amounts by territory (e.g., Australia with 1.693 million due in 2011, Canada with 2.106 million), totaling 14.155 million due.
This project likely leverages Python libraries such as Pandas for data manipulation, Matplotlib or Seaborn for visualizations, enabling the creation of interactive charts and tables to analyze order trends, territorial performance, and financial metrics over time.