Sales and Order Performance
تفاصيل العمل
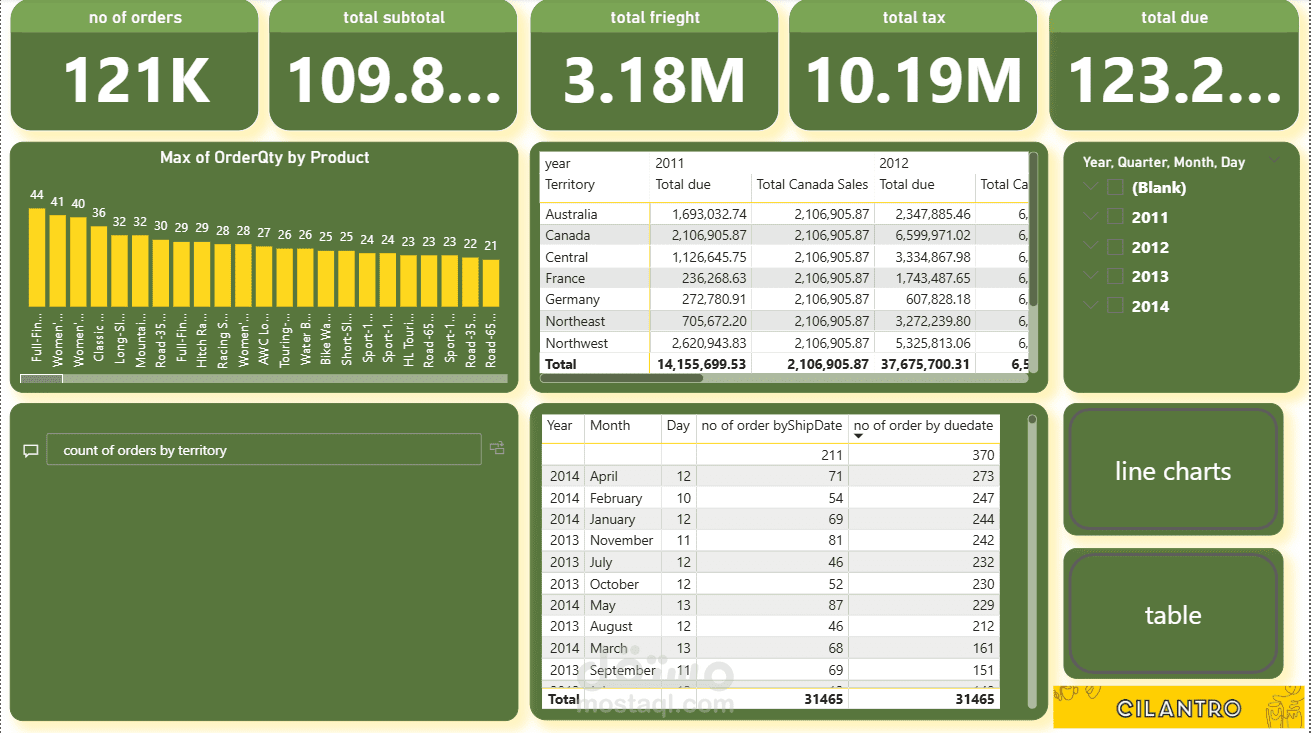
The "Sales and Order Performance Report" project, as shown in the dashboard, is a detailed analysis of sales and order activities, incorporating SQL and data modeling techniques. The report highlights the following key insights:
- **Number of Orders**: 333 orders.
- **Number of Order Details**: 5,563 entries.
- **Subtotal**: 8 million.
- **Total Freight**: 233,000.
- **Total Tax**: 746,000.
- **Total Due**: 9 million.
- **Orders by Year**: A steady increase from 84 orders in 2011 to a peak of 708 orders in 2013, followed by a decline to 340 in 2014.
- **Count of Order Quantity by Product Category**: Clothing leads with 24, followed by Accessories (14), Bikes (19), and Components (16).
- **Orders by Status**: 86 (58.7%) are Approved, 33 (22.5%) are In Process, 19 (13%) are Shipped, with smaller percentages for Cancelled, Rejected, and Backordered.
- **Orders and Total Due by Territory**: Canada tops with 155 orders and 4.4M due, followed by Northwest (87 orders), France (46 orders), and others with varying due amounts.
This project likely uses SQL queries to extract and aggregate data from order and sales tables, while modeling techniques (e.g., relational database design or predictive modeling) help analyze trends and categorize product performance across territories and years.