Sales Performance Dashboard
تفاصيل العمل
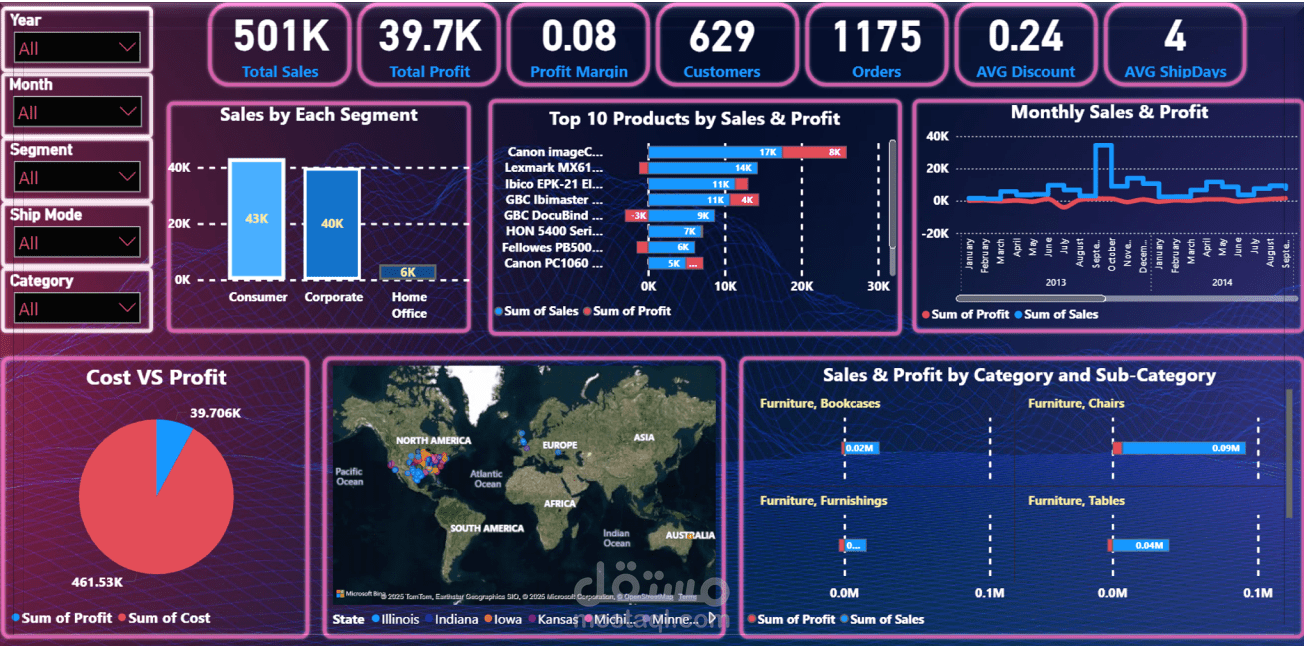
The goal of this project was to design an interactive and dynamic dashboard that enables business decision-makers to monitor global sales performance, track profitability, and identify top-performing segments, categories, and products. The report allows for deep insights into customer behavior, order patterns, and regional performance.
---
Key insights provided by the dashboard:
Total Sales: 501K
Total Profit: 39.7K
Profit Margin: 8%
Total Customers: 629
Total Orders: 1175
Average Discount: 0.24
Average Shipping Days: 4
---
Visual elements include:
Bar Chart: Showing sales distribution across customer segments (Consumer, Corporate, Home Office).
Combo Chart: Highlighting top 10 products by total sales and profit
Line Chart: Displaying monthly sales and profit trends over time
Pie Chart: Comparing total cost versus total profit
Map Visualization: Showing geographic sales and profit distribution by state.
Bar Charts: Analyzing sales and profit by category and sub-category