data analyst
تفاصيل العمل
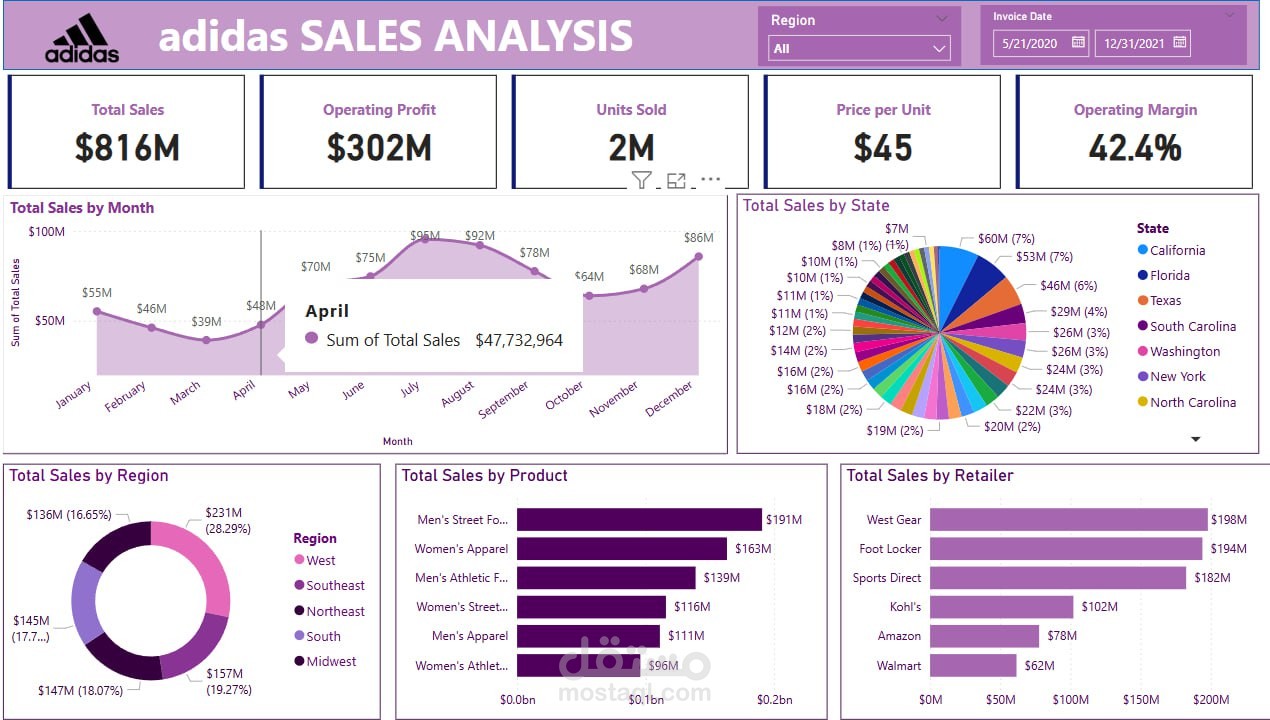
Built an interactive dashboard using Power BI visualizations.
Designed reports to display:
Sales trends over time
Performance across states and regions
Comparison of different retailers
Sales breakdown by product categories
Organized the dashboard layout to ensure it’s clear, easy to use, and provides valuable business insights.