Sales Performance Dashboard – Power BI
تفاصيل العمل
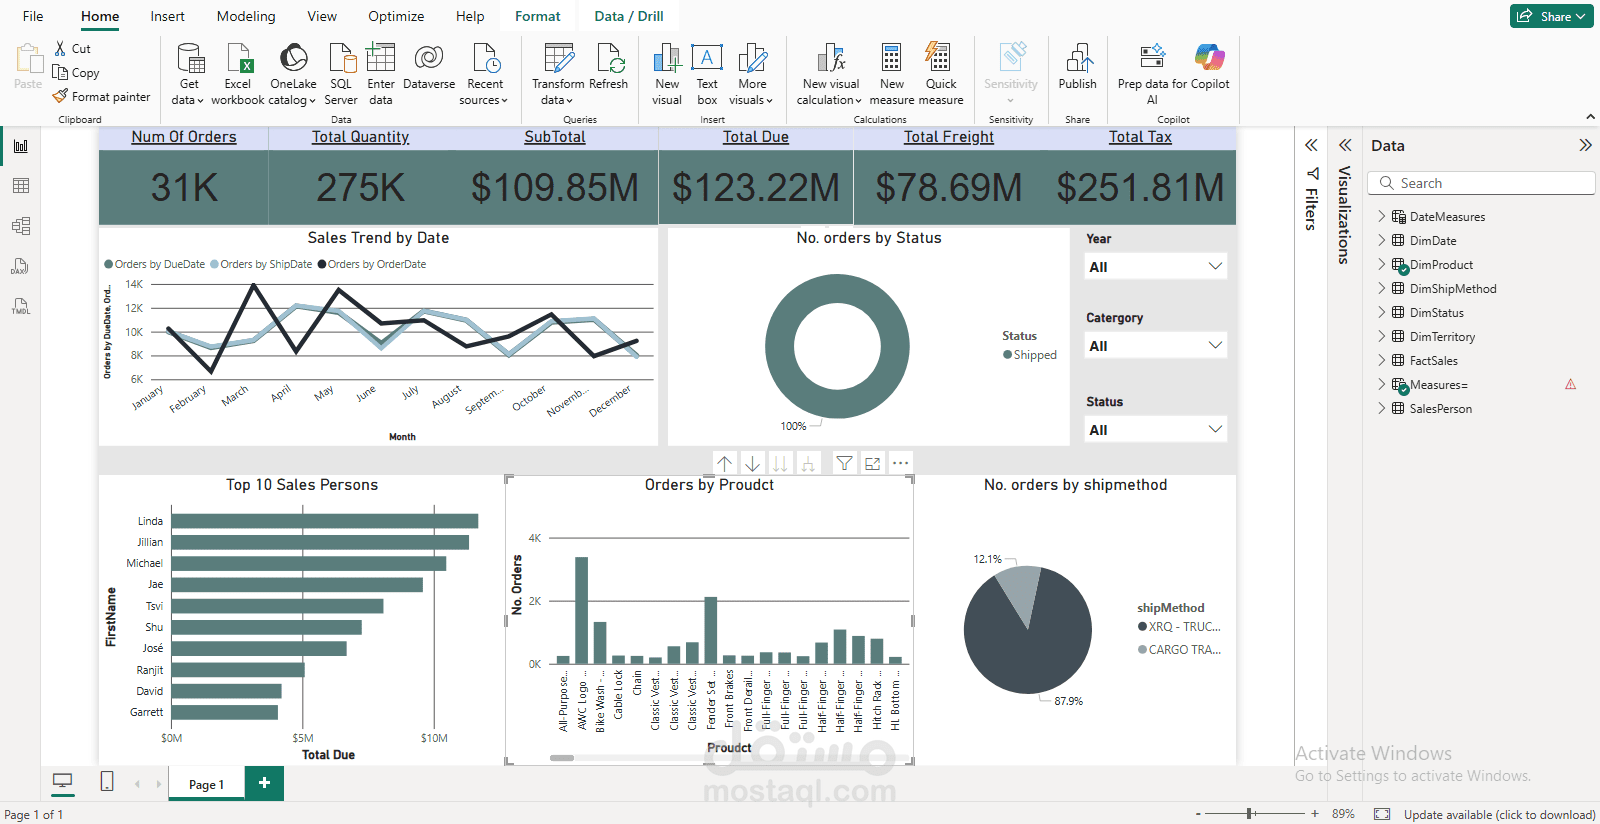
I designed and developed an interactive Sales Performance Dashboard in Power BI to provide clear business insights and support decision-making.
Prepared and cleaned raw sales data for analysis.
Built a relational data model (Fact & Dimension tables).
Created DAX measures to calculate KPIs such as Total Orders, Revenue, Quantity, Tax, and Freight.
Designed interactive visualizations (line charts, bar charts, donut and pie charts).
Added dynamic filters (Year, Category, and Status) for customized analysis.
Delivered a professional and fully functional dashboard for sales tracking