student performance analysis
تفاصيل العمل

Project Description
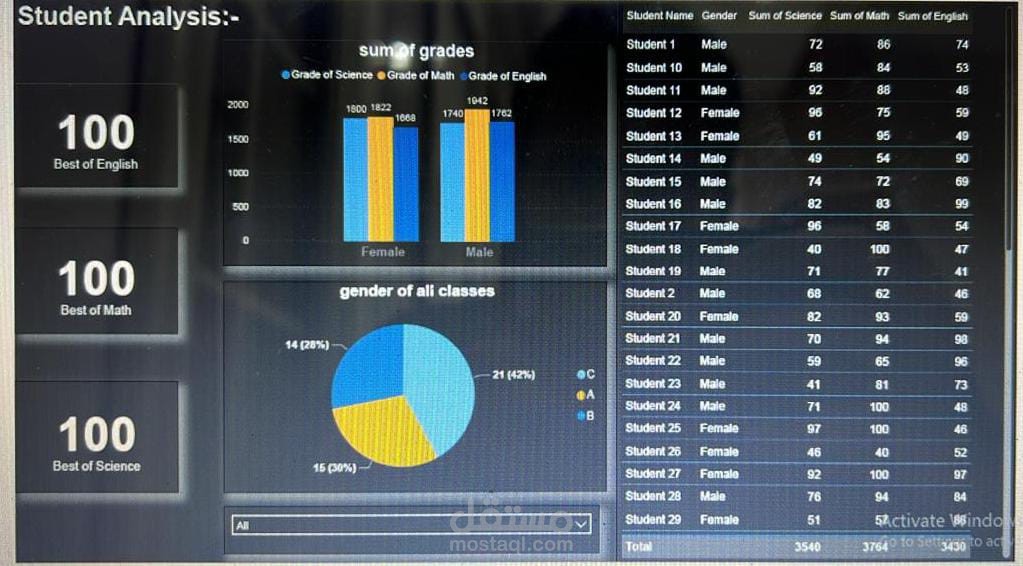
This project is a Student Performance Analysis Dashboard designed to visualize and evaluate student academic performance across three main subjects: English, Math, and Science. The dashboard highlights the best scores in each subject, provides a gender-based comparison of total grades, and presents the overall distribution of students by class.
Key features include:
Top Scores: Displays the highest grade achieved in English, Math, and Science.
Grade Analysis: A bar chart comparing the total grades of male and female students across all subjects.
Class Distribution: A pie chart showing the percentage of students in different classes (A, B, C).
Student Records: A detailed table listing each student’s name, gender, and individual subject scores.
This dashboard helps teachers and administrators track performance trends, identify top achievers, and analyze differences in student outcomes by gender and class, supporting better decision-making and academic planning.