Top 250 Movies
تفاصيل العمل
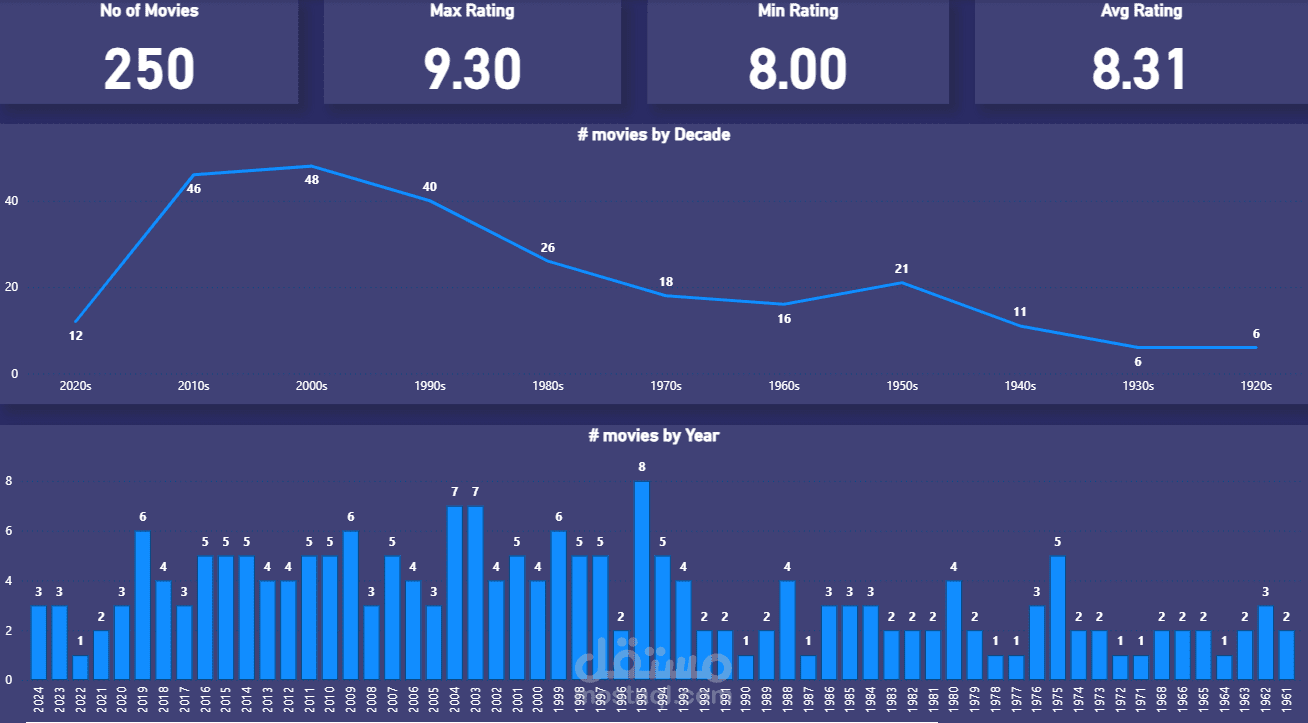
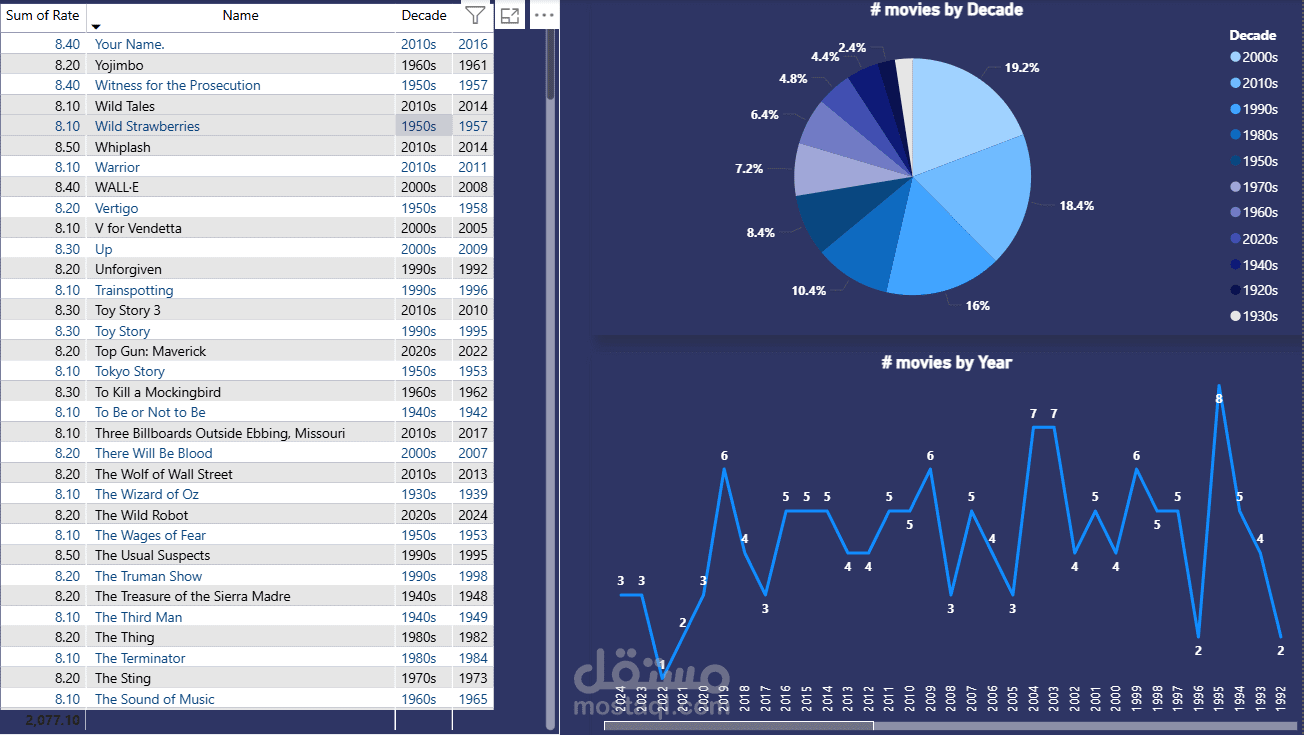
This dashboard analyzes the Top 250 Movies dataset, which I connected to directly from a web data source. It provides insights such as:
Number of movies by decade and year
⭐ Minimum, maximum, and average ratings
Interactive visuals to compare trends across time
Processes
: Data extraction from a web source
Data cleaning and transformation
Building relationships between tables
Designing interactive and insightful visualizations
Tools :
Power Query
Power BI