PowerBI Project about Airline Delay Causes
تفاصيل العمل
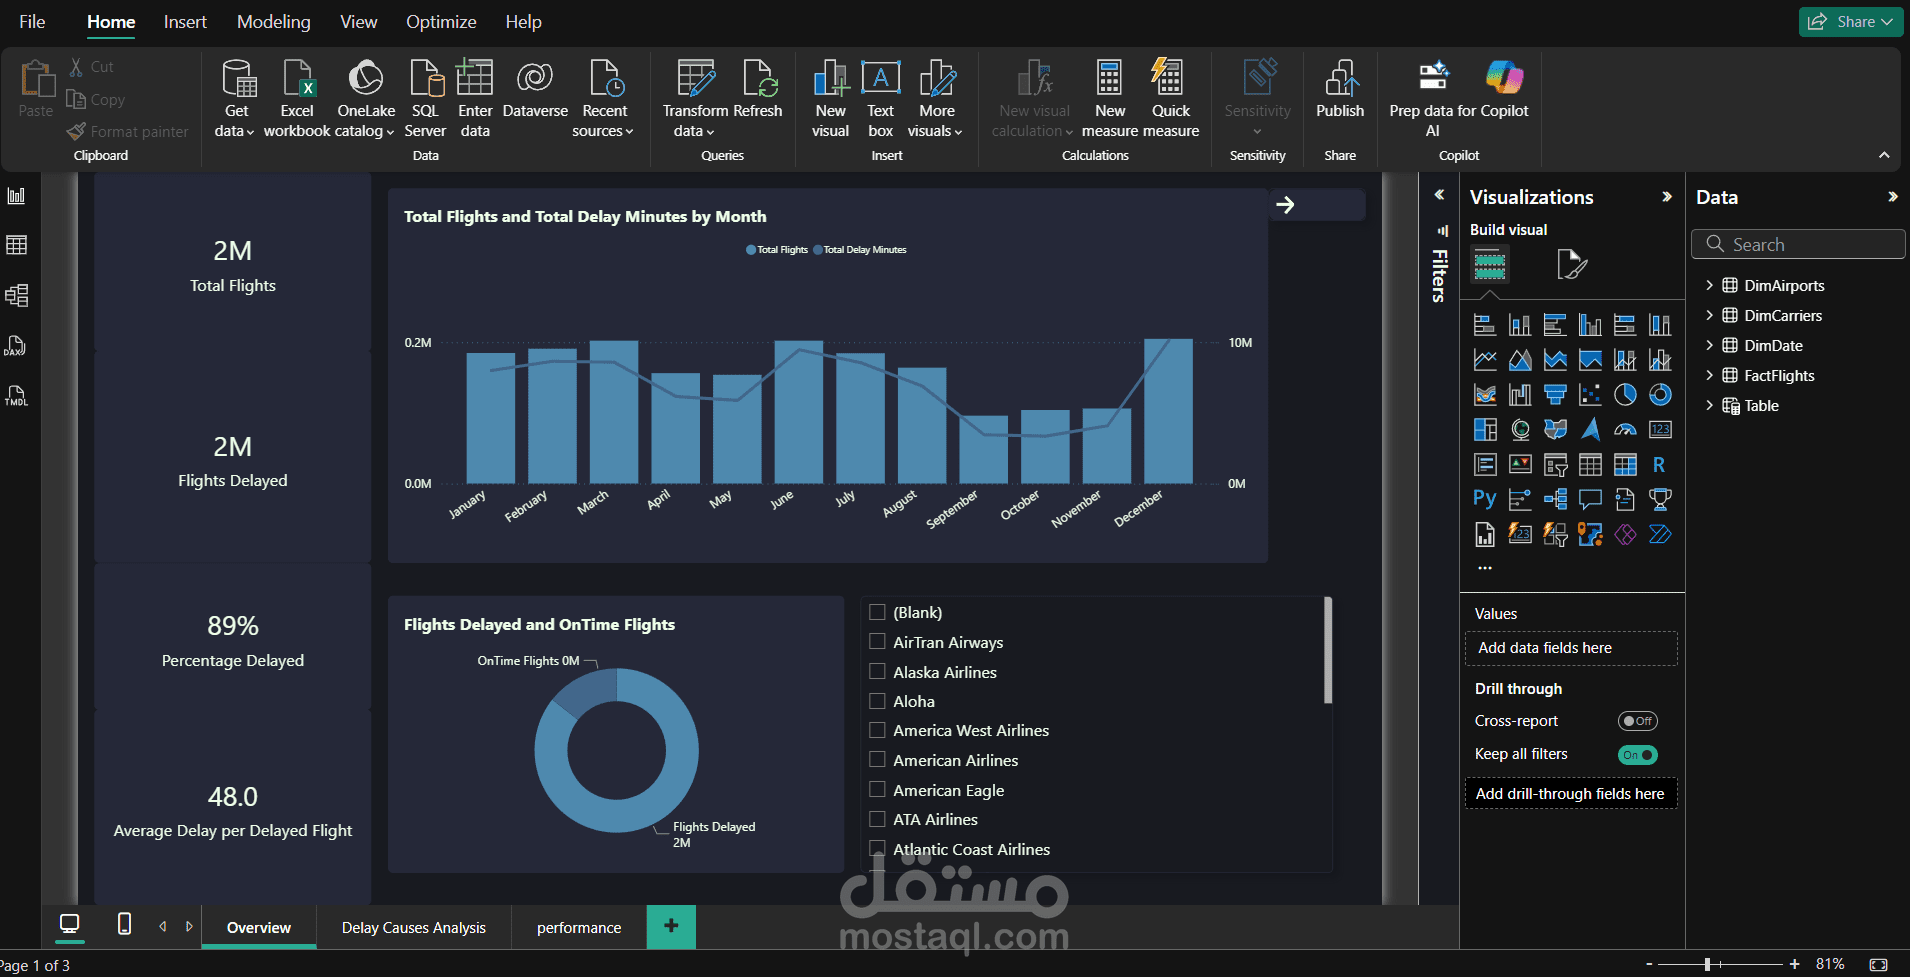

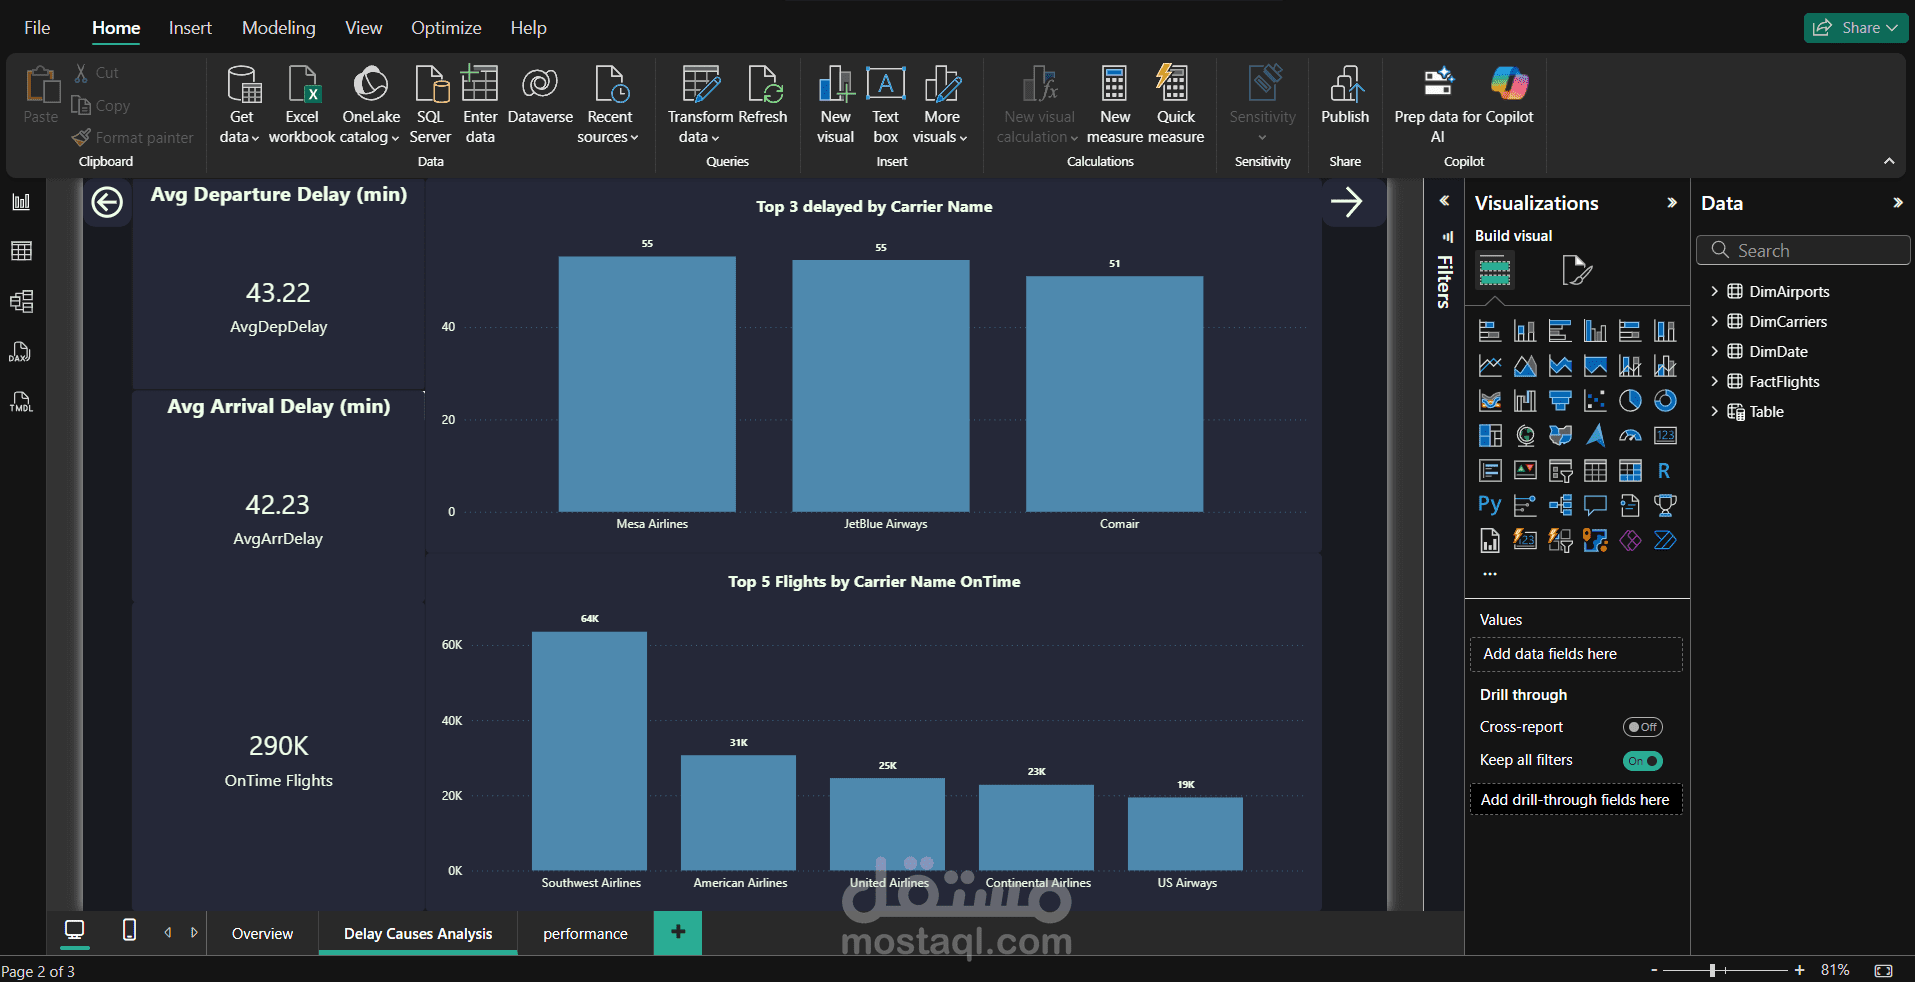
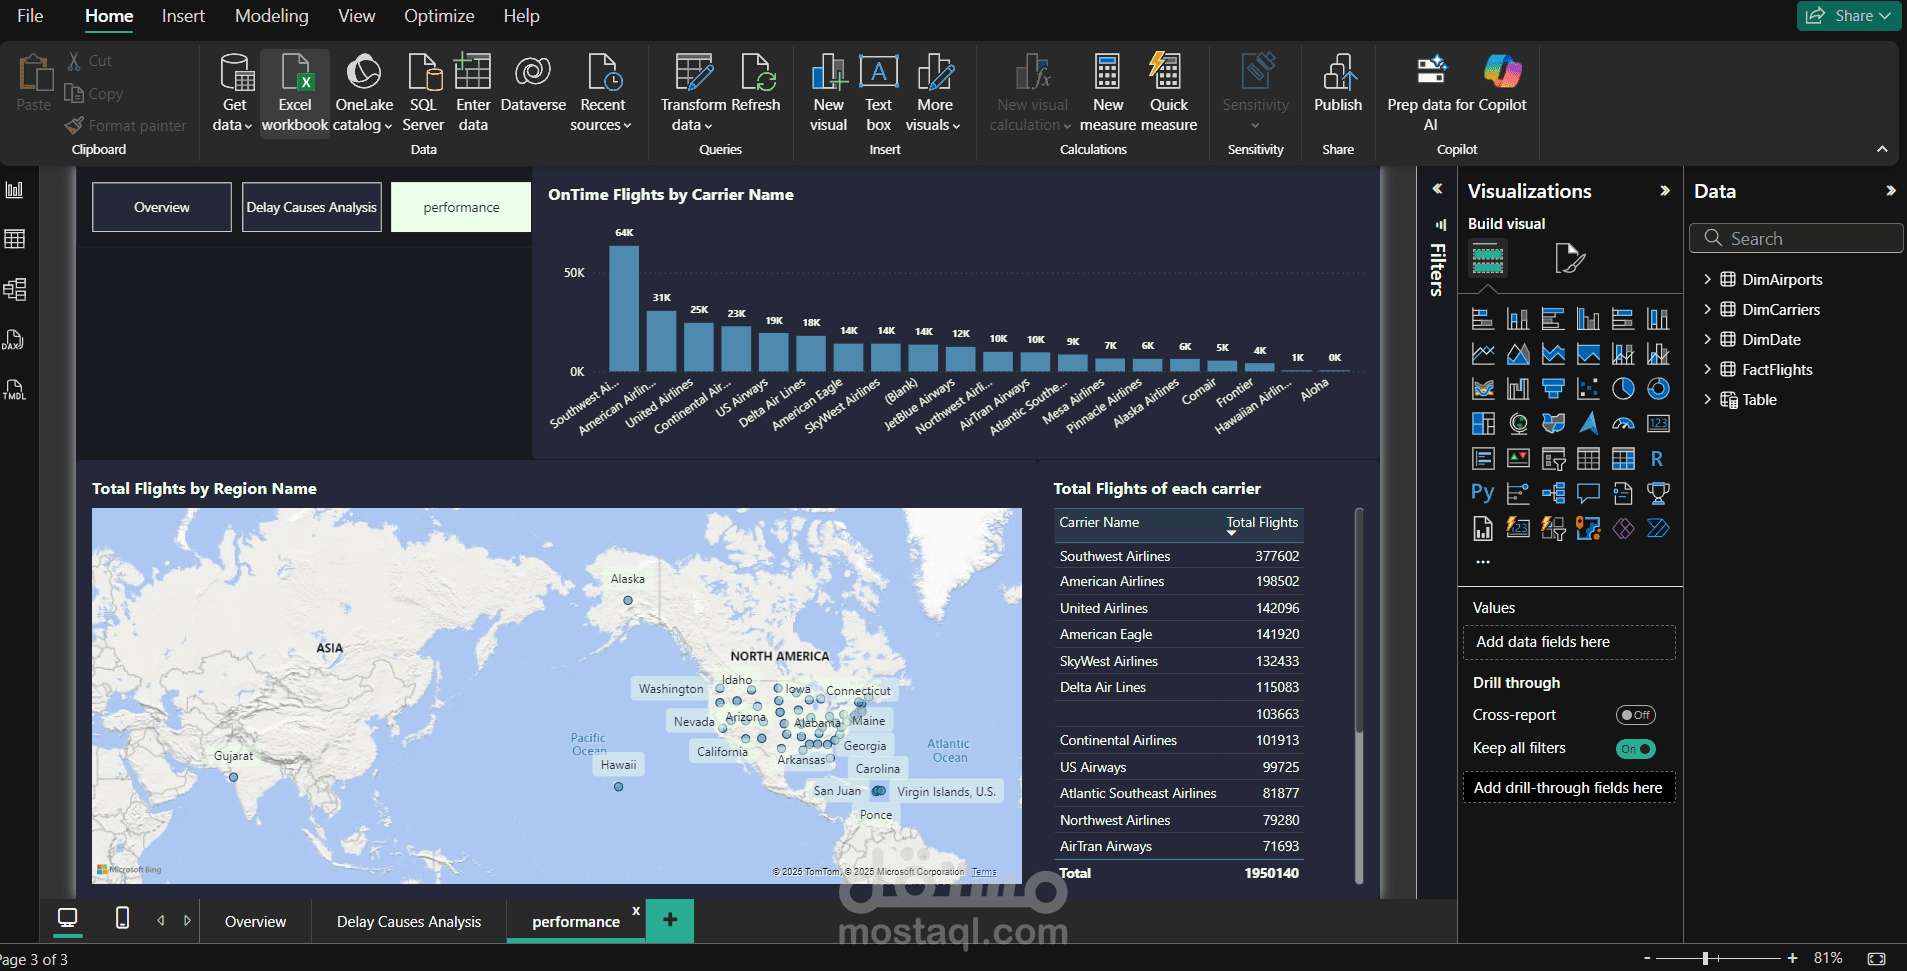
Project description.
• Designed a dashboard consisting of three distinct pages.
• Populated these three pages with various visuals as you see fit to best represent the data and uncover trends related to airline delays.
• Considered different aspects of the data for each page (e.g., an overview page, a delay cause analysis page, a carrier/airport performance page).
• Implemented clear navigation between the three dashboard pages.