World Economic & Social Insights 2023 – Interactive Dashboard
تفاصيل العمل
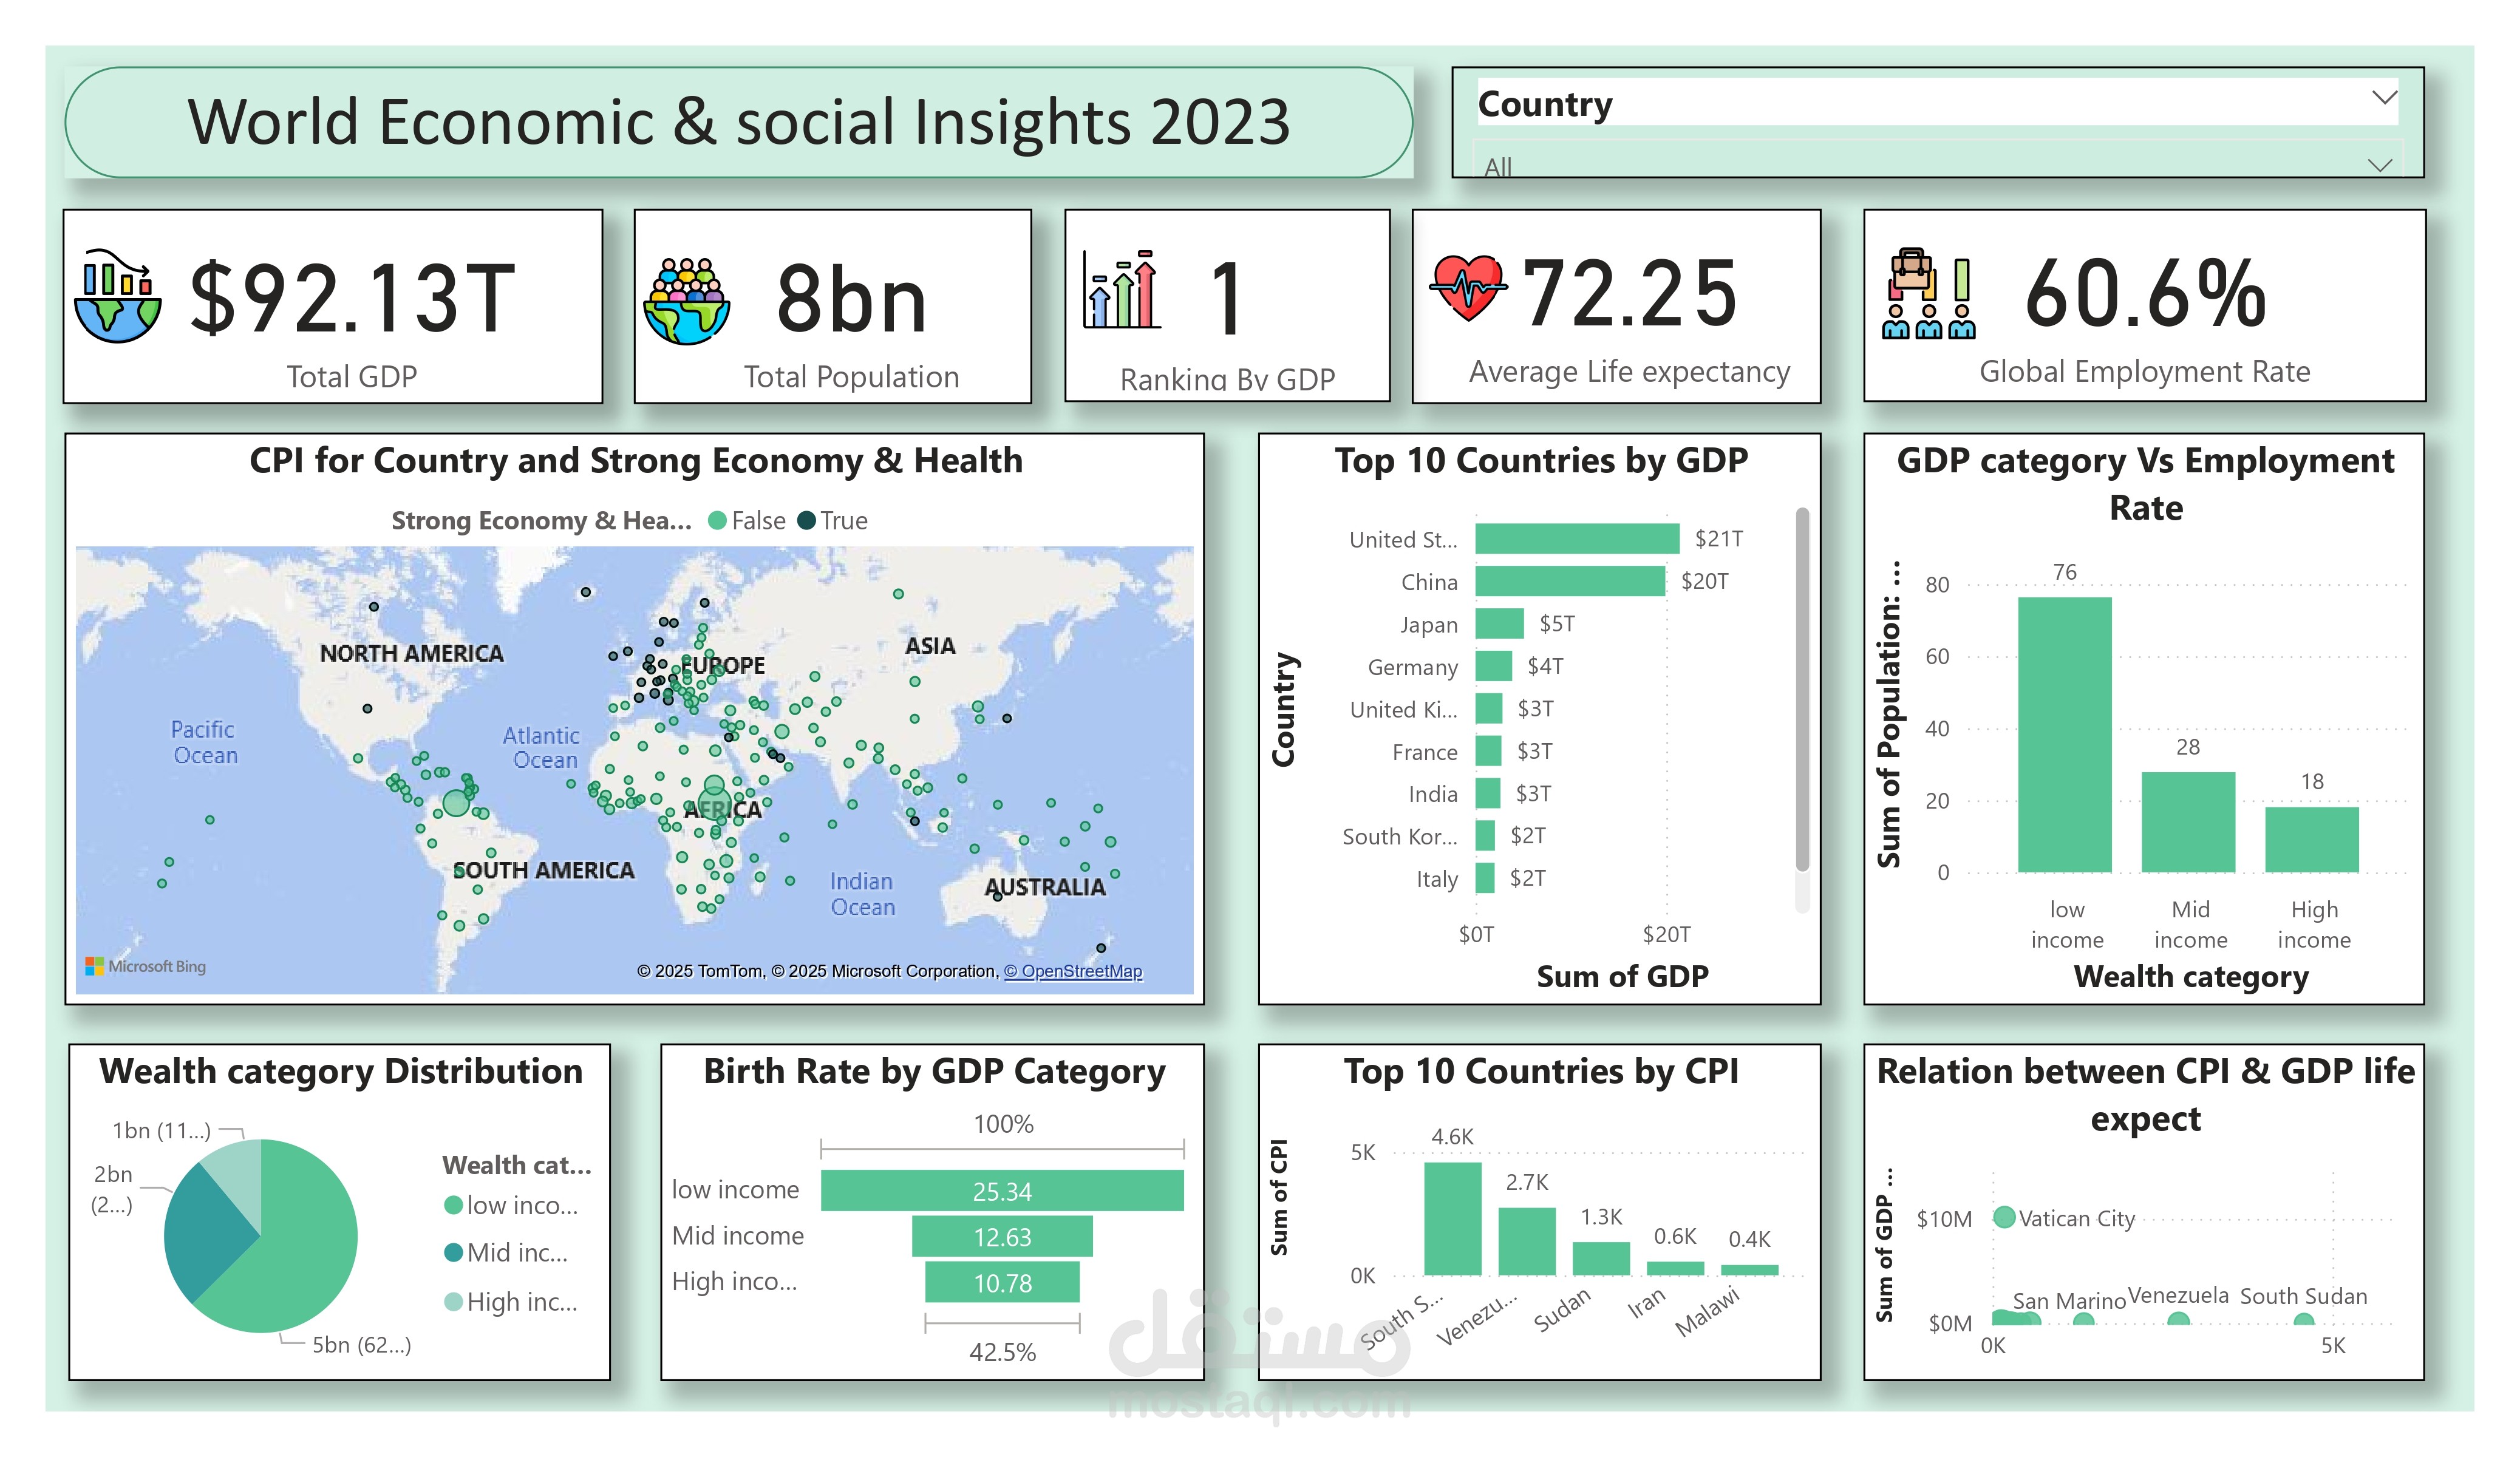
This project involved designing a professional interactive dashboard in Power BI using the cleaned global dataset.
Visualized key economic and social indicators, including GDP, population, employment rate, life expectancy, and wealth distribution.
Built dynamic charts such as GDP vs. Employment, CPI vs. GDP & Life Expectancy, and Top 10 countries by GDP & CPI.
Created interactive filters and drill-downs for country-level insights.
Provided a data-driven view of global trends to support strategic and policy decisions.
The dashboard offers a comprehensive overview of global economic performance, helping stakeholders easily identify patterns, disparities, and growth opportunities.