Sales Performance Dashboard | Excel
تفاصيل العمل
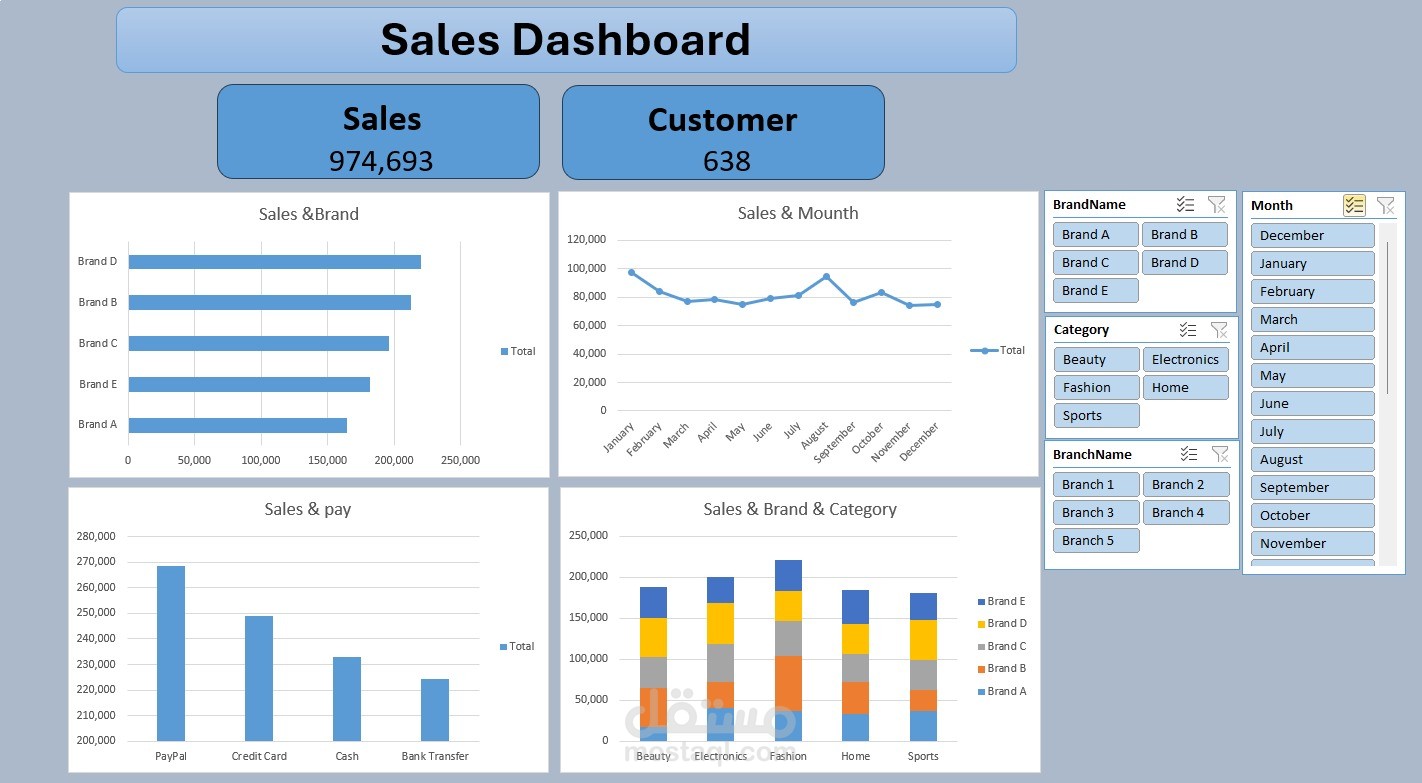

Designed and built an interactive Sales Dashboard from scratch using Excel, analyzing 974K+ in total sales across 5 brands, 4 branches, and 5 product categories.
Key Insights delivered:
• Brand D was the top performer, leading all brands in total revenue
• Fashion category generated the highest sales across all categories
• PayPal was the most used payment method, followed by Credit Card
• Sales trend remained consistent across months with peaks in Jan & Aug
Tools used: Pivot Tables · Slicers · Charts · Conditional Formatting
Skills demonstrated: Data Cleaning · Dashboard Design · Sales Analysis · Business Reporting