dashboard
تفاصيل العمل

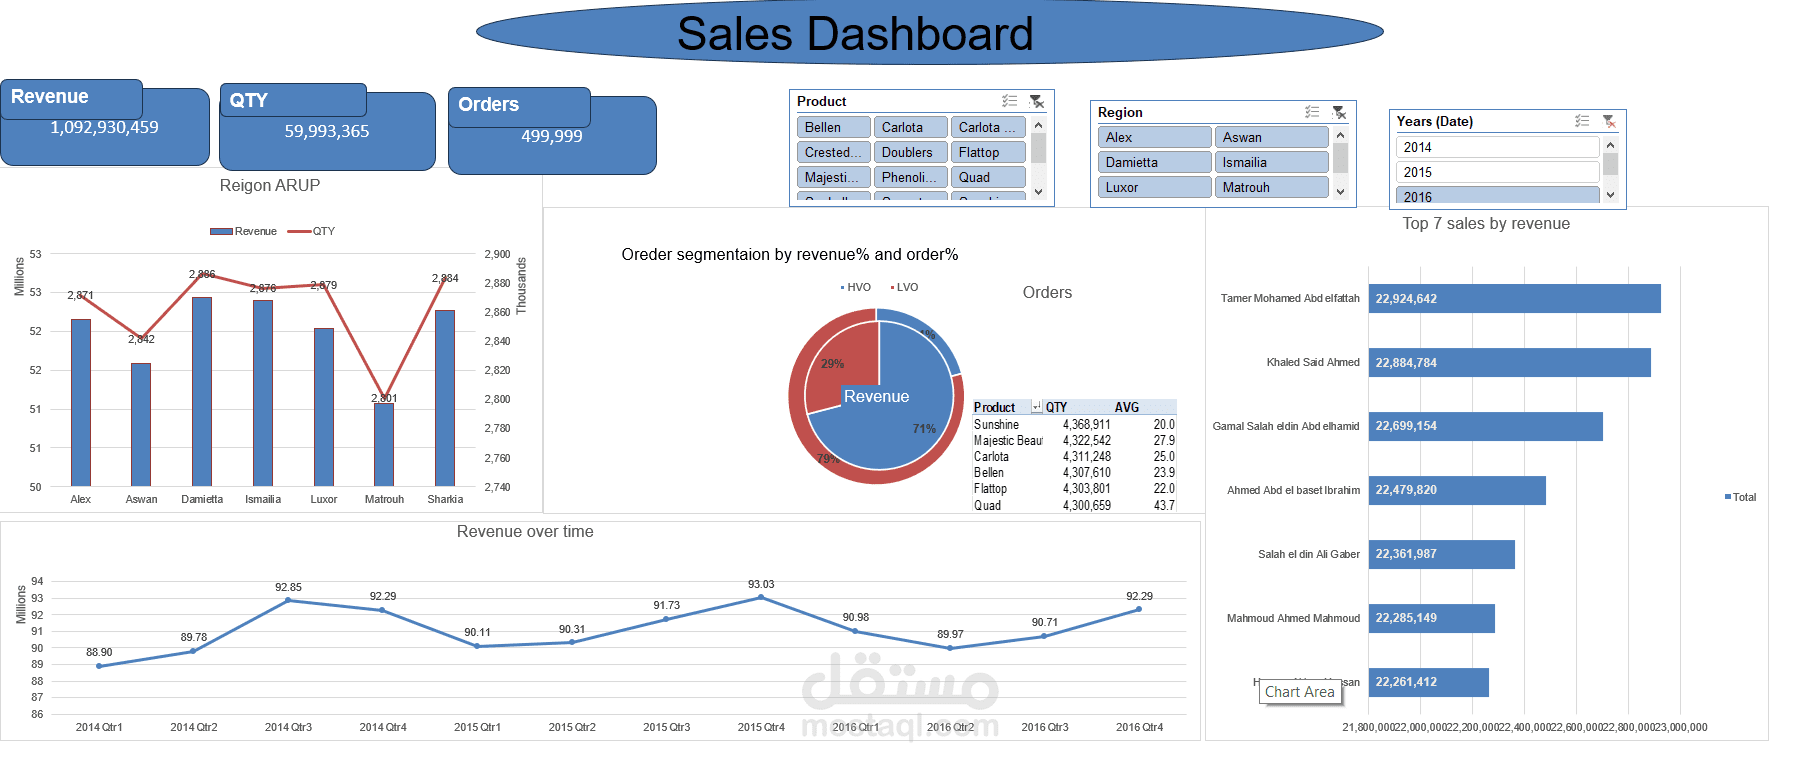
Objective:* Turn complex datasets into actionable insights in a clear and visually engaging format.
*Key Insights Delivered:*
* A summary of total revenue, units sold, and number of orders
* Top 7 salespersons ranked by revenue
* Regional performance analysis based on revenue and units
* Yearly and quarterly revenue breakdown
* Average price calculation for each product
* Contribution analysis of HVO and LVO based on revenue classification
*Tools & Techniques Used:*
* Pivot Tables and Pivot Charts
* Custom Excel formulas and calculated fields
* Conditional formatting for better data visualization
* Clean and minimal design for user-friendly interpretation