Sales Analysis Project
تفاصيل العمل
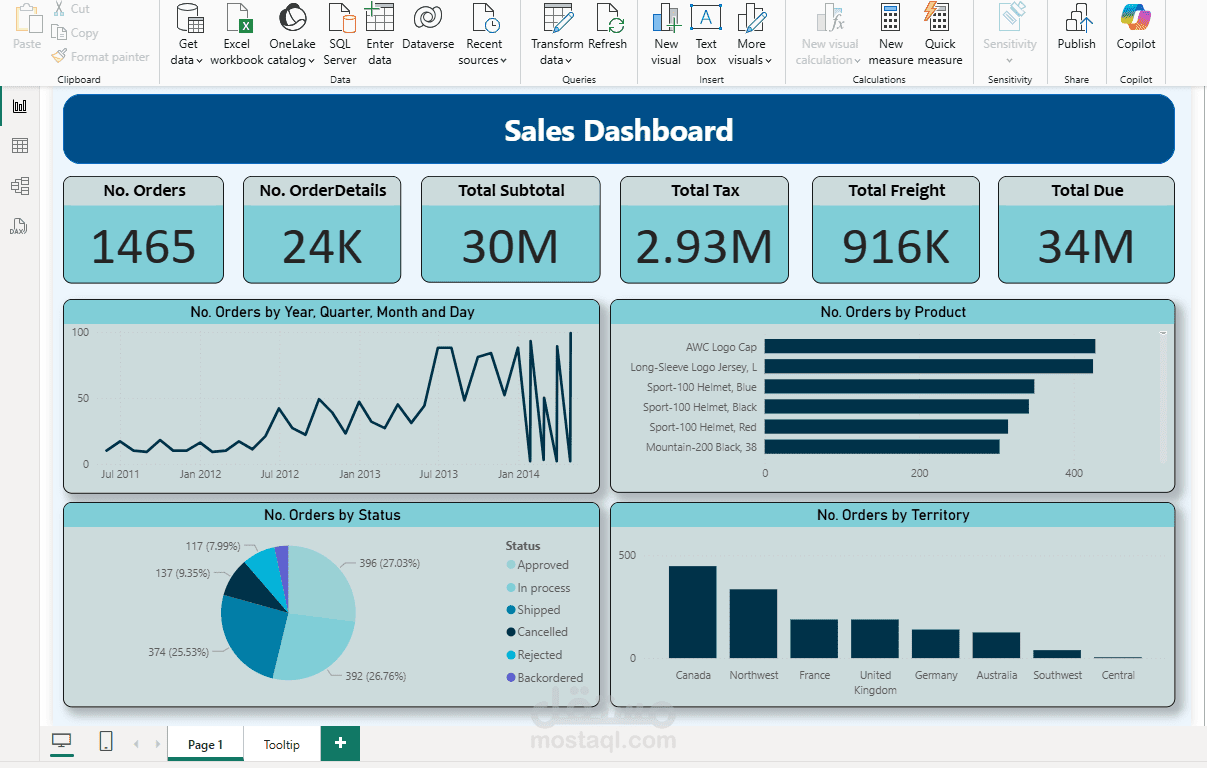
This interactive Sales Dashboard provides a comprehensive view of sales performance across different dimensions. It includes key performance indicators (KPIs) such as the total number of orders, order details, subtotal, tax, freight, and total due.
The dashboard highlights:
Trends over time: Orders analyzed by year, quarter, month, and day using a line chart.
Product analysis: Top products by number of orders displayed in a bar chart.
Order status distribution: A pie chart showing proportions of approved, shipped, cancelled, rejected, and backordered orders.
Geographical insights: Orders segmented by territory for regional performance comparison.
This dashboard enables decision-makers to quickly monitor overall sales performance, track product demand, evaluate order processing status, and analyze sales across different regions.