Adventure Work Dashboard
تفاصيل العمل
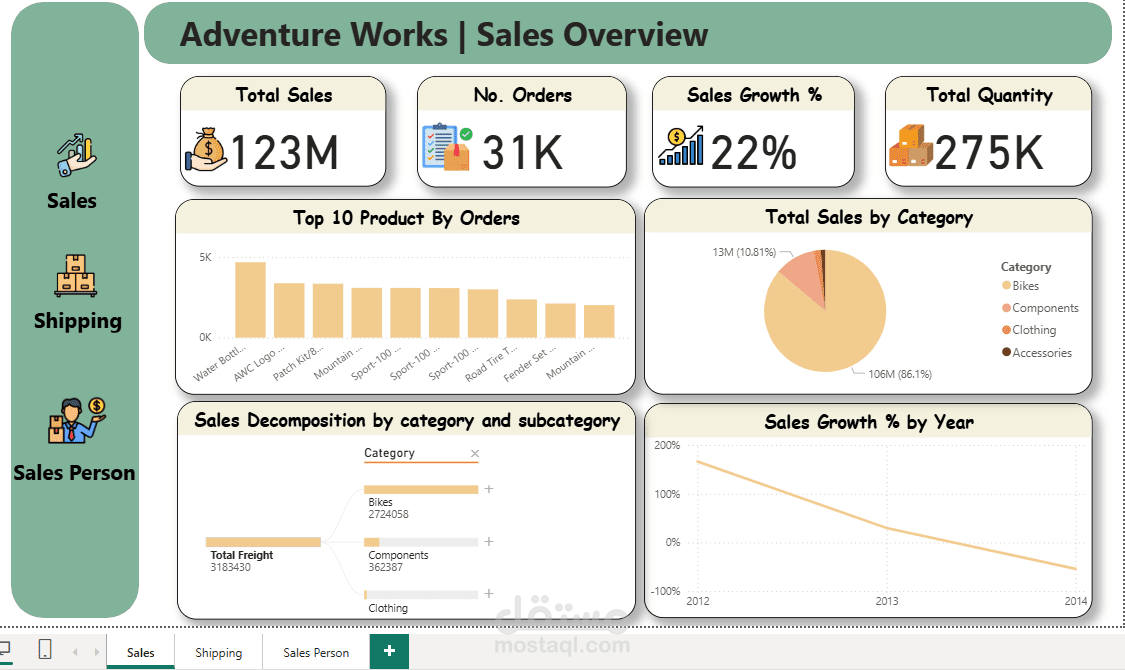
This Adventure Works Sales Overview Dashboard provides a clear summary of sales performance across key business dimensions. It tracks essential KPIs including Total Sales (123M), Number of Orders (31K), Sales Growth (22%), and Total Quantity (275K).
The dashboard highlights:
Top Products: A bar chart displaying the top 10 products by number of orders.
Category Analysis: A pie chart showing sales distribution across Bikes, Components, Clothing, and Accessories.
Sales Decomposition: Breakdown of sales by category and subcategory to identify major revenue contributors.
Growth Trends: A line chart illustrating year-over-year sales growth percentage.
This dashboard helps stakeholders monitor overall performance, evaluate product demand, analyze category contributions, and track sales growth trends to support data-driven decisions.