dashboard
تفاصيل العمل
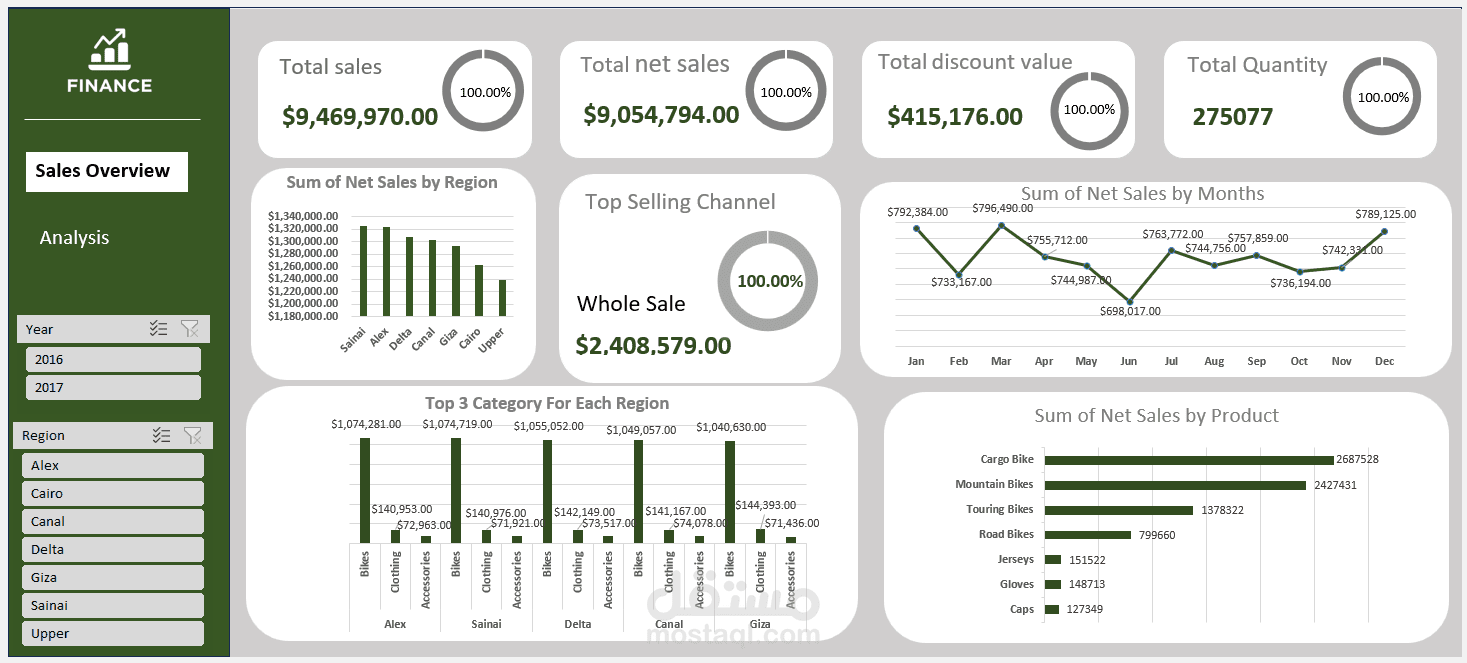
I created a dynamic and interactive Excel dashboard designed to visualize and analyze key data insights effectively. The dashboard includes automated charts, slicers, pivot tables, and conditional formatting to highlight important trends and KPIs. It allows users to filter data easily, track performance over time, and make data-driven decisions with clarity and speed. The layout is clean, user-friendly, and fully customizable to fit specific business needs