لوحة تحليلات المبيعات والمخزون – تحليل أداء قطاع التجزئة
تفاصيل العمل

شروع متكامل لتحليل المبيعات والمخزون يبرز قدرات متقدمة في تحليل البيانات باستخدام Excel وPower BI. توفر اللوحة رؤى فورية حول أداء المبيعات، وإدارة المخزون، وعمليات التشغيل داخل شركة تعمل في قطاع التجزئة.
المميزات الرئيسية:
تحليل أكثر من 47,000 عملية بيع عبر 5 فئات منتجات
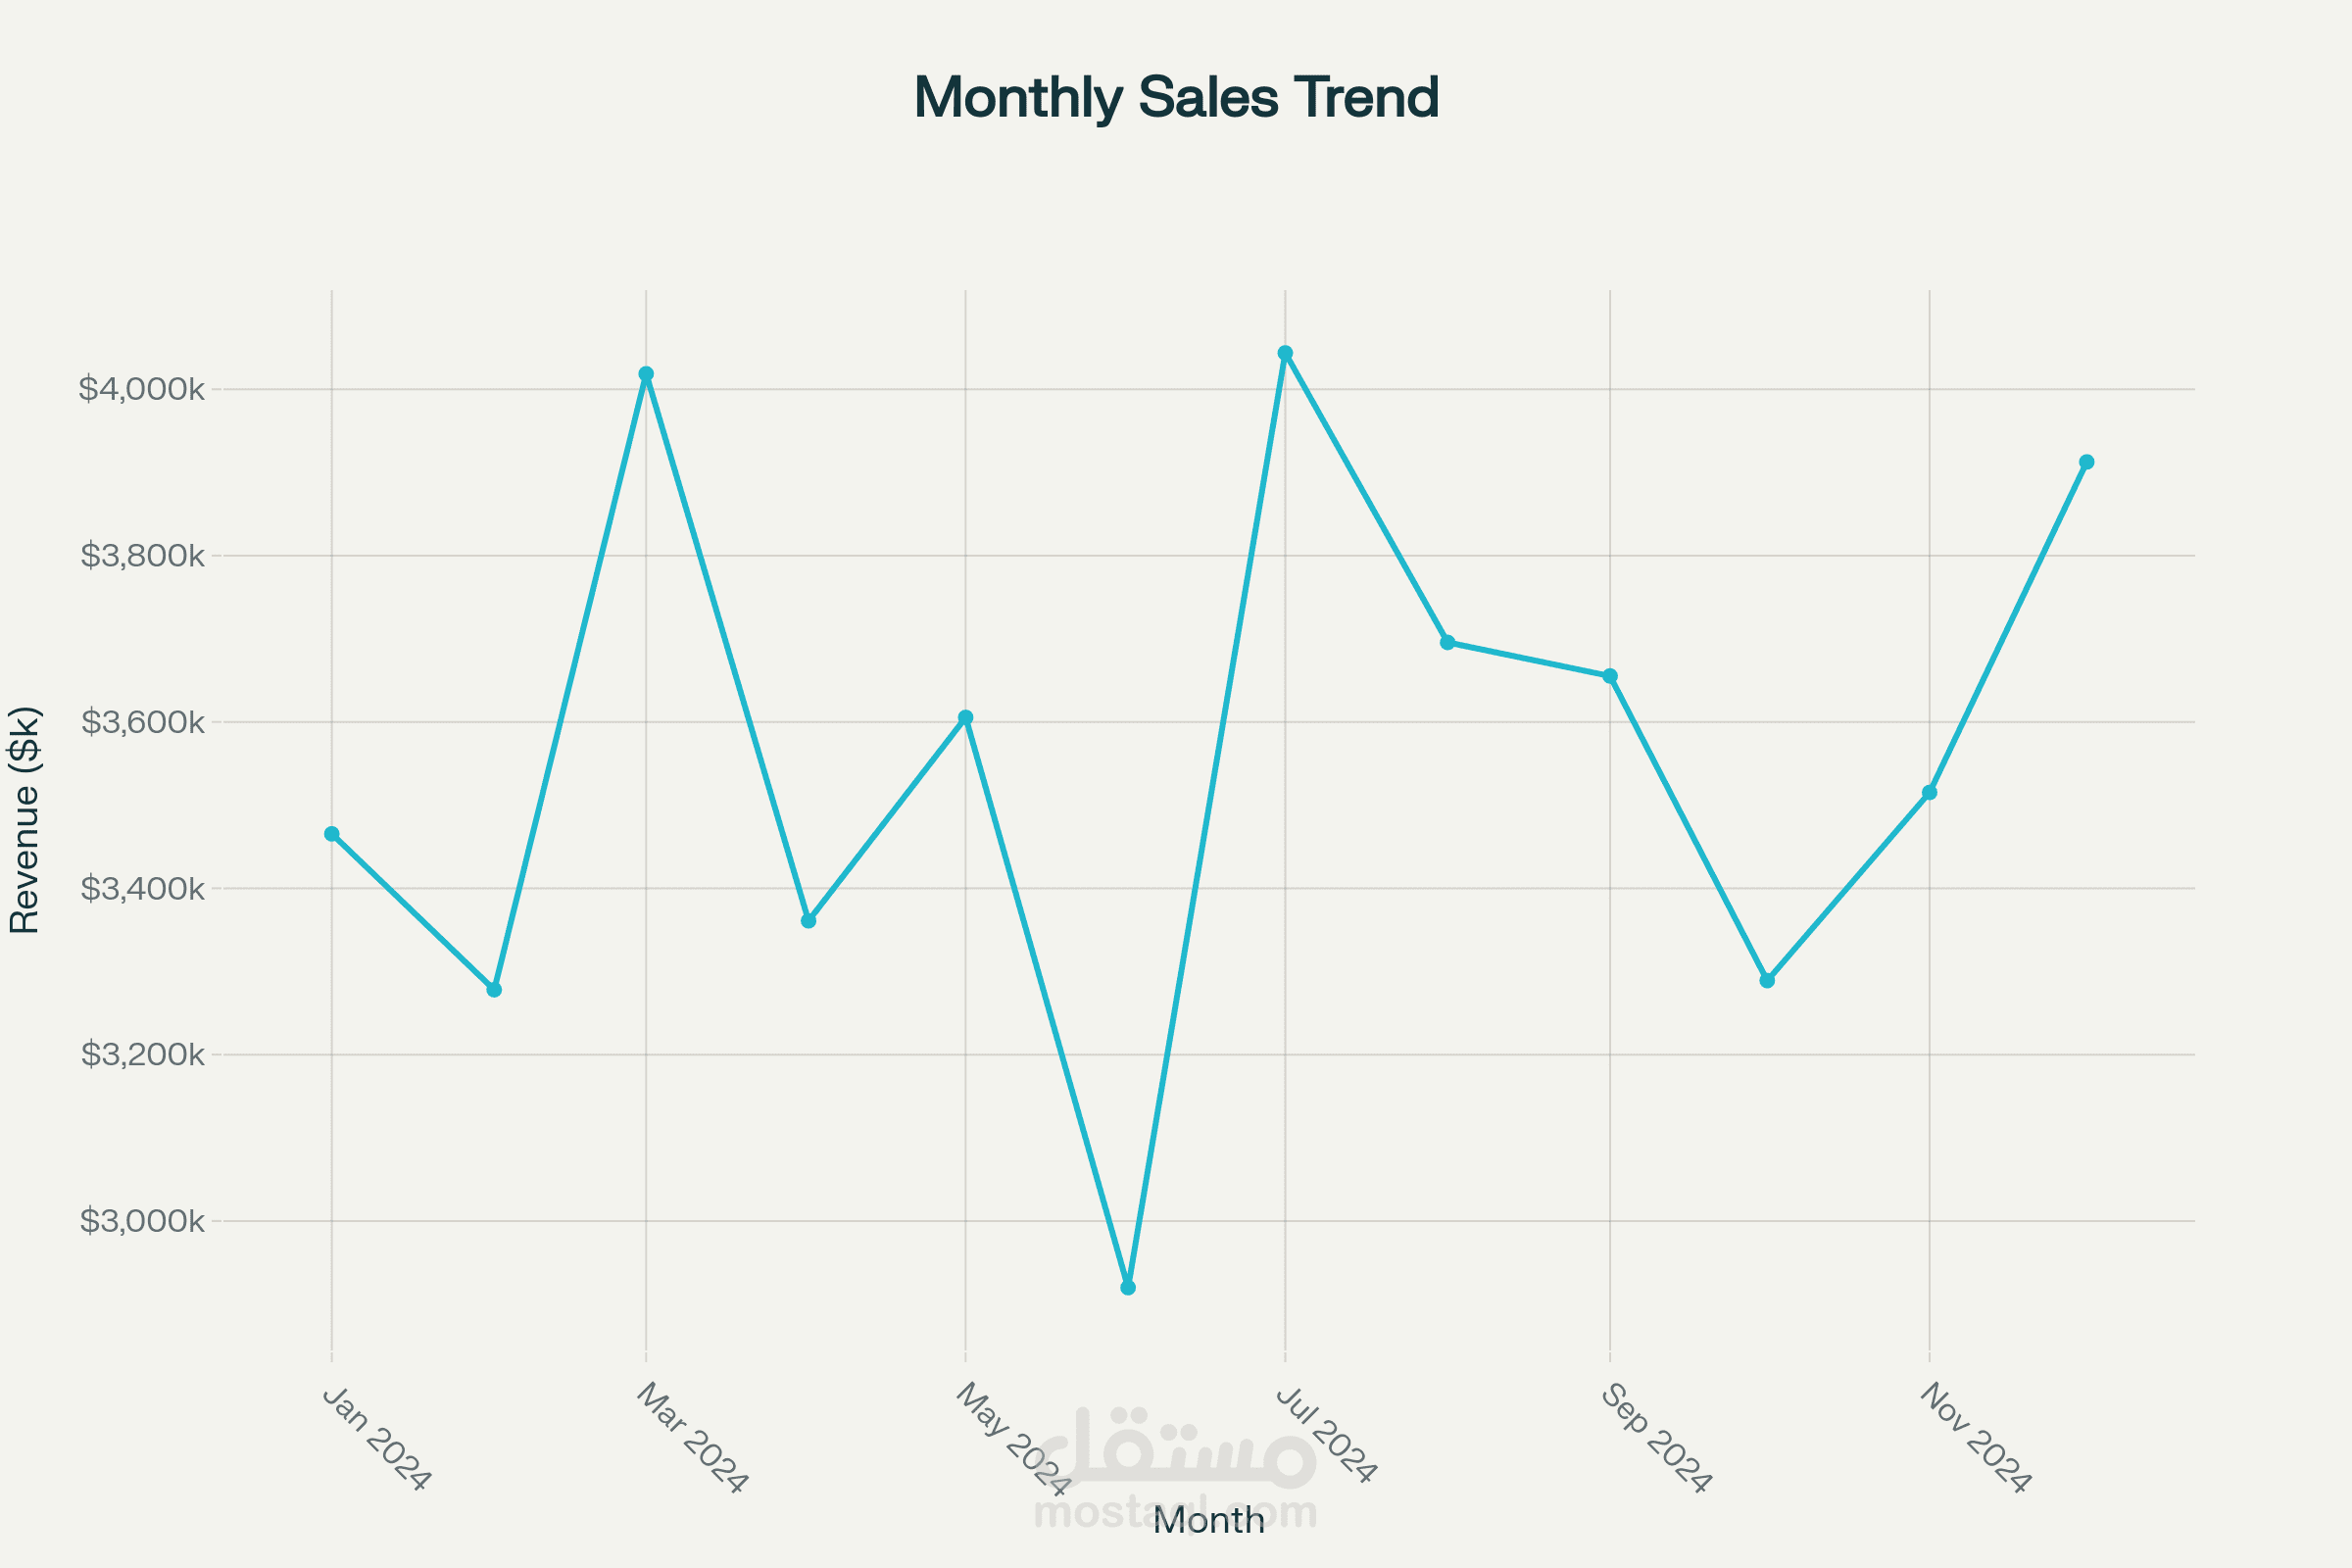
تصورات تفاعلية توضح اتجاهات المبيعات الشهرية، وأداء الفئات، وأفضل المنتجات مبيعًا
تحليل تحسين المخزون مع متابعة مستويات إعادة الطلب ورؤى لإدارة المخزون
تتبع أداء مندوبي المبيعات والمقارنة بينهم
تحليل توزيع الإيرادات ومؤشرات الربحية
تحديث تلقائي للبيانات وإمكانية التصفية الديناميكية
تم استخدام وظائف متقدمة في Excel مثل الجداول المحورية (Pivot Tables)، ودالة VLOOKUP، والتنسيق الشرطي، والتحقق من صحة البيانات. كما تم توظيف Power BI لإنشاء لوحات معلومات تفاعلية تدعم خاصية التعمق في التفاصيل (Drill-Down) ومتابعة مؤشرات الأداء الرئيسية بشكل فوري.